Why Do Fewer Women Work in India? A Supply–Demand Perspective
Reading Time: 7 minutes

DOWNLOADS
Executive Summary
India’s ambition to become a developed nation by 2047 hinges, among other things, on tapping its underutilised female labour force. At a per capita gross domestic product (GDP) of roughly USD 9,800 [1] (World Bank Group, 2024), India’s female labour force participation rate (LFPR) stands at 35% (International Labour Organization [ILO], n.d.)—well below the global average of 59% and also lower than peer economies such as Vietnam, Indonesia, the Philippines, and Bangladesh, where LFPR ranges from 42–68% [2,3] (The World Bank Group, 2024). The current low level represents a notable improvement from the 21% participation rate in 2017–2018. A higher female LFPR is beneficial not just for faster GDP growth, but for achieving better outcomes on health and education also. If India manages to achieve the average female LFPR for the developed world, it would add between USD 700 billion and USD 1.4 trillion in incremental GDP at current productivity levels.
This raises two fundamental questions: 1) What explains India’s low female LFPR relative to its peers? and 2) Why did it decline from 2004–2005 to 2017–2018 and then rebound? Since female LFPR is about employed women and those looking for work, there ought to be demand- and supply-side factors that drive the female LFPR. In this paper, we decompose the female LFPR into a country’s per capita GDP, the labour intensity of the overall economy (labour force/GDP), the female intensity (female labour force/total labour force), and the country’s demographic composition. [4,5] A higher GDP/capita implies a higher demand for goods and services, and thus a higher demand for labour (and capital). Differences in labour intensity reflect the relative costs (and benefits) [6] of using labour vs capital in production processes, and hence is a function of both labour demand and supply. Finally, differences across countries in terms of female intensity are largely driven by societal norms. [7] We use this core decomposition framework to answer our two central questions.
What Explains India’s Low Female LFPR Relative to its Peers?
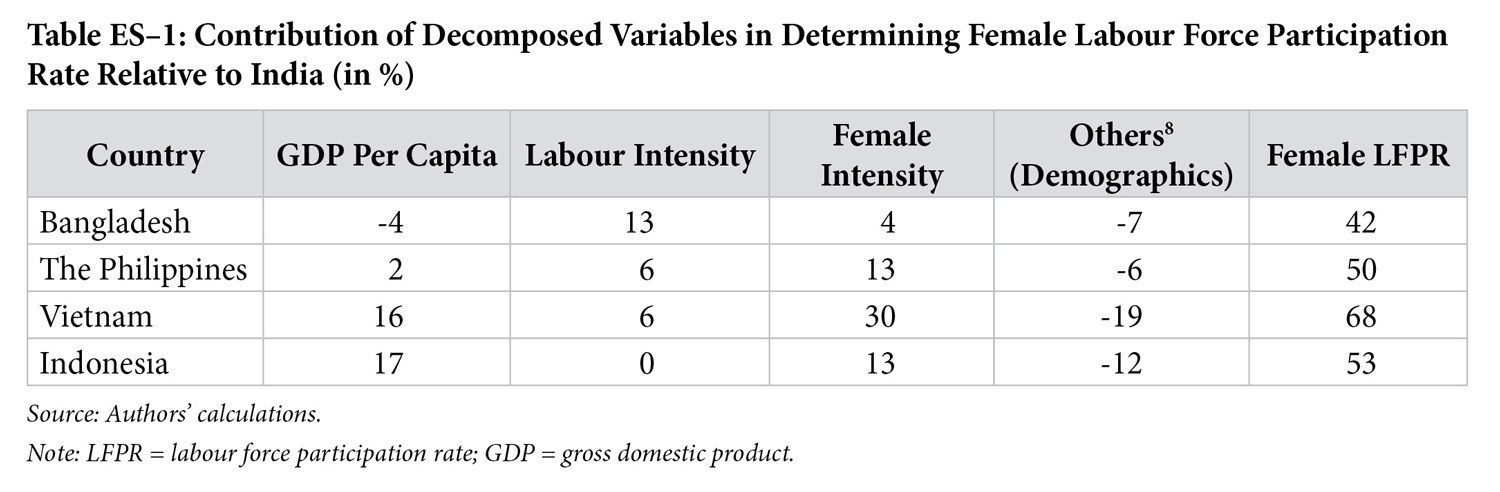
The decomposition framework helps us understand the reason(s) responsible for India’s low rate compared to its peers. We find that if India had Bangladesh’s labour intensity, India’s female LFPR would rise by 13% (keeping other components constant), whereas if India had Bangladesh’s female intensity, it would increase India’s female LFPR by 4%. Conversely, the Philippines’ female intensity in India’s context would increase India’s female LFPR by 13%, with labour intensity playing a secondary role in increasing India’s female LFPR by 6%. This is the first big finding of the paper—contrary to the bulk of the literature, which gives primacy to India’s norms as a binding constraint keeping female LFPR low, our decomposition shows an equally important role of labour intensity in pulling down female participation. This also passes the smell test—in labour-abundant countries like India, where the bulk of the labour force is in the informal sector with low wages, an increase in female labour supply alone in response to relaxation of norms would imply an increase in female employment but the expense of a reduction in wages. An increase in demand, on the other hand, increases employment and wages.
Why Did Female LFPR Decline From 2004–2005 to 2017–2018 and Then Rebound?
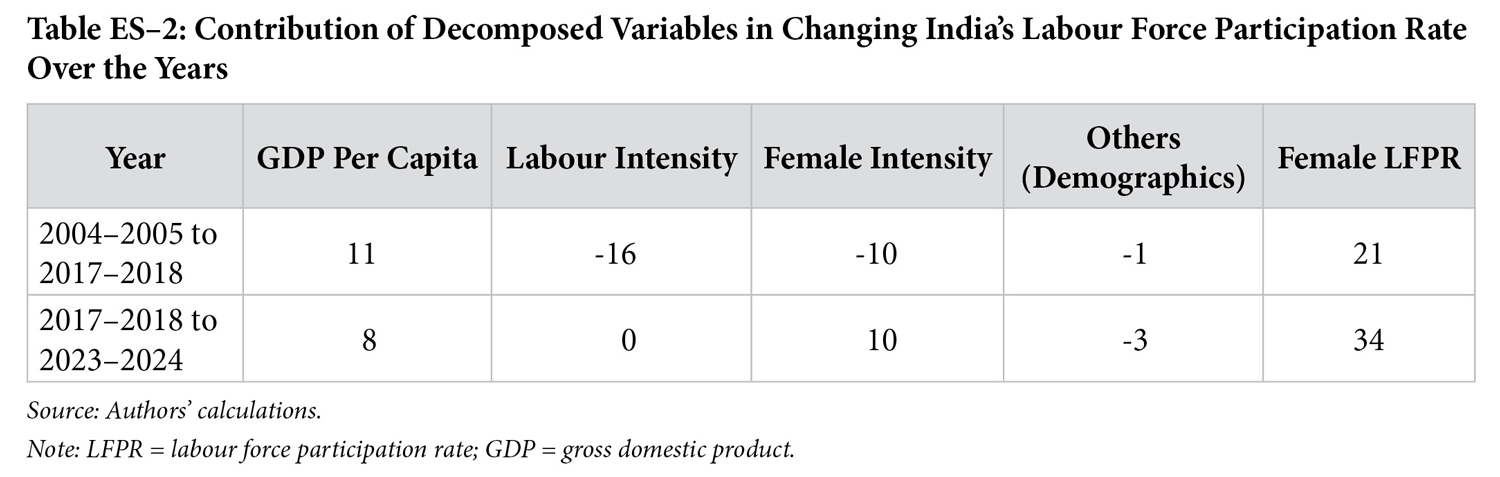
Between 2004–2005 and 2017–2018, India experienced a sharp decline in female LFPR from 37% to 21%, even as real GDP per capita doubled while overall labour employment fell by 3%. That is why this pattern is often described as “jobless growth.” The decline was concentrated among rural women, many of whom are employed in agriculture, making a sudden drop in labour demand unlikely as the cause. Juxtaposing the decline in female participation with macro correlates like education enrolment, growth of rural GDP, and wage growth during this period suggests a supply-side contraction as a more plausible explanation for the decline in female LFPR. First, there was a significant rise in education enrolment: Secondary and higher education enrolment increased by 50% and 100%, respectively, adding around 45 million more students—many of whom would otherwise have entered the workforce. Second, rural incomes increased at a much faster pace compared to urban areas—per capita GDP growth in rural areas grew 1% faster than their urban counterparts during 2000 and 2012. Rapid increases in rural household income may have reduced the need for women to work. Third, significantly higher wage growth during this period points to a tight labour market. [9]
Between 2017–2018 and 2023–2024, India’s female LFPR increased significantly from 21% to 34%, thereby reversing much of the earlier decline. Our decomposition analysis indicates that the bulk of this increase was due to a rise in female intensity in the subsistence sector [10] (Lewis, 1954). Since this was accompanied by a commensurate decrease in agricultural productivity by 9%, and a decline in wages of the self-employed by 32%, we argue that this increase was led by supply-side forces. The jury is out on whether this increase was distress-led, Basole et al. (2023) or a benign impact of MGNREGA and DAY-NRLM programmes, as reflected by Sinha (2025).
What is Required to Spur Female Participation?
Our cross-country decomposition makes a fundamental point. The demand for labour has a pivotal role to play in determining female LFPR. This perspective shifts the policy focus from interventions solely aimed at increasing women’s participation in total employment to expanding the overall employment opportunities in the economy. Since demand-side levers pertain to the ease of deploying labour vs capital for production processes, governments and businesses have a big role to play in enabling them to hire more labour and correcting policies that hurt the labour intensive industries.
A few key recommendations emerge to push labour demand in India:
- Enhancing labour market flexibility: India’s labour laws are onerous, with 15% of firms citing them as a major constraint—far higher than 3.4% in Bangladesh and 6.4% in the Philippines. While the four New Labour Codes (effective from November 21, 2025) are a welcome step, more reforms are needed to boost labour intensity by improving capital–labour ratios in favour of labour.
- Promoting labour-intensive industries through tariff reforms: Peer countries excel in low-skilled labour-intensive sectors. India’s low-skilled, labour-intensive industries account for about 16% of the GDP, significantly below peers such as Indonesia (26%) and Bangladesh and the Philippines (21%). India’s high tariffs hinder this. For example, a 20% tariff on man-made synthetic yarn for textiles (vs 13% in Bangladesh) raises costs and hurts competitiveness. The Union Budget 2026–2027 announced the National Fibre Scheme to boost domestic production of man-made and synthetic fibre in India. It remains to be observed whether this scheme will reduce the overall production cost, which is critical for competitiveness. India must also correct tariffs and sign deep Free Trade Agreements (FTAs) for enhanced market access. The recent FTA with the EU and bilateral trade talks with the US are important steps. Domestic investments, such as the just-announced MITRA parks, may also play an important role in supporting export-driven demand in textiles.
- Increasing public investment in health and education: These sectors are labour- and female-intensive. In both these areas, India’s current outcomes need significant improvement. One of the key reasons for their lack of performance is less-than-adequate state expenditure. As against a recommended level of 3% of GDP, governments in India (both the Government of India [GoI] and the State governments combined) spend about 1% of their GDP on public health expenditure (Raj, Dalal, & Gupta, 2024). Thus, a higher spend on these core services will directly increase female LFPR by increasing the demand for women’s work, and indirectly by raising the quality of human capital in the long run.
For long, a low female LFPR has been attributed to India’s patriarchal norms. The women’s reservation bill, passed in 2023, giving them 33% reservation in the parliament and state assemblies, will be historic when implemented. Nonetheless, a sustained rise in female labour force participation will also require a broader expansion in labour demand, essential in enabling more women to enter and remain in the workforce.
Q&A with authors
What is the core message of your paper?
India’s low female labour participation rate (LFPR) at 35% cannot be explained by social norms alone; instead, insufficient labour demand plays an equally important role in explaining the low rate globally and relative to peer economies with female LFPRs between 42-68%. The cross-country decomposition framework showcases that differences between female LFPRs are driven by both labour intensity (total labour/GDP) and female intensity (norms). The central takeaway is that increasing women’s participation requires strong demand-side reforms, such as lowering constraints posed by stringent labour laws, expanding the share of labour-intensive sectors through restructuring tariffs and domestic stimulus, and human development by investing in health and education. Increasing female LFPR through the demand side, therefore, would unlock a virtuous cycle: higher job creation, higher labour intensity, and better female participation rates, leading to better socio-cultural norms and further increases in female LFPR.
What presents the biggest challenge?
The biggest challenge is, first, making labour attractive for businesses; currently, 15% of firms in India cite labour laws as a major obstacle, as compared to 3.4% in Bangladesh and 6.4% in the Philippines. There is a need to make these laws more flexible. Second, expanding the share of labour-intensive industries in India, the share of low-skill labour intensive industries in India is 16% as compared to 26% in Indonesia and 20-21% in Bangladesh, the Philippines, and Vietnam. Focusing on correcting tariffs and signing FTAs in these sectors is required to expand their share in GDP. Third, this increase needs to be in the productive sector; the recent rise in female LFPR between 2017-18 and 2023-24 appears to be more in the subsistence sector, without a demand-side push evidenced by declining wages in self-employment and falling agriculture productivity.
What presents the biggest opportunity?
The biggest opportunity for India is add USD 700 billion to USD 1.4 trillion to its GDP by boosting its female LFPR. Through policy and structural reforms, it can make its growth story more labour-intensive and become closer to attaining its ambition of becoming Viksit Bharat. Additionally, improving female LFPR would, in turn, improve the social norms which act as constraints for women, creating a virtuous cycle.
FOOTNOTES
[1] GDP per capita PPP, constant 2021 international USD.
[2] The average for the low- to middle-income countries is 41%.
[3] It is worth noting that India’s male participation rate of 75% is at par globally. Please see Appendix A for the chart.
[4] Female Labour Force Participation Rate = Females in the labour force ÷ Eligible females in the population
[5] Female LFPR = (GDP per capita) * (Total labour force/GDP) * (Female labour/total labour) ÷ Demographic composition of females
[6] Relative benefits of labour versus capital depend on the underlying production processes, which are broadly similar across peer countries, and hence do not distinguish the labour demand.
[7] Female intensity differs significantly across countries: India at 0.31, Bangladesh at 0.35, and the developed world at 0.49. Since the share of the female population is very close to half (0.5) in most countries, such a significant difference in their employment share must be because of their ability and willingness to participate, driven by norms.
[8] This element reflects the denominator of the equation—representing the available women in any country on the basis of the demographic of the population and any variations in the sex ratio.
[9] See Appendix F.
[10] The subsistence sector includes agriculture and self-employment based on the Lewis Dual economy model proposes the presence of a traditional low-productivity/subsistence sector (agriculture and self-employment) with surplus labour and a modern capitalist/productive sector.
Shishir Gupta
Aalhya Sabharwal


Find on this page
The Centre for Social and Economic Progress (CSEP) is an independent, public policy think tank with a mandate to conduct research and analysis on critical issues facing India and the world and help shape policies that advance sustainable growth and development.