
Between Expectation and Realisation: India’s Private Investment Paradox
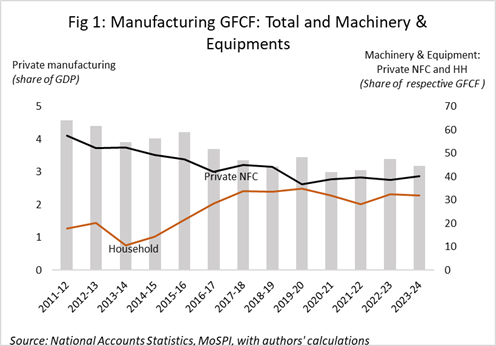
Reading Time: 7 minutesThe weakness is most visible in manufacturing, where capital formation has steadily fallen since 2011-12 ( by 1.5 percentage points) to around 3% of GDP. Much of this is due to slowing machinery and equipment investments, which drive industrial growth.
India’s investment slack has persisted for over a decade. Despite accelerating growth, many structural reforms, and public capex stimulation, nominal aggregate investment share in GDP remains about 5 percentage points below the 2007-08 peak (36%). The weakness is most visible in manufacturing, where capital formation has steadily dried up, falling ~1.5 percentage points since 2011-12 to around 3% of GDP.
Much of this retreat can be attributed to a prominent slowing of machinery and equipment investments, which drive industrial growth. Such investments by private nonfinancial corporations dropped sharply by 17 percentage points between 2011-12 and 2023-24 (Figure 1). The pattern differed for households, whose machinery and equipment shares in total fixed assets increased ~20 percentage points between 2013-14 and 2017-18 but stagnated at about one-third thereafter.
The declines are no doubt concerning. What is even more so is the steady and enlarging disparity in planned investments with secured financing and the actual realisation, even as the former have been falling steeply in relation to GDP. This underscores how India’s private-investment malaise runs far deeper and is proving more intractable than commonly understood. This blog previews our research highlights.
A Decade of Weak Realisation
Figure 2 plots the planned investment values as per cent of GDP compiled from RBI data on financially approved projects by banks, financial institutions, and equity. The central bank gauges the annual private investment outlook from this information, which captures the spending intentions of firms for new capacity, machinery and equipment, or infrastructure, once their projects move past the planning phase.
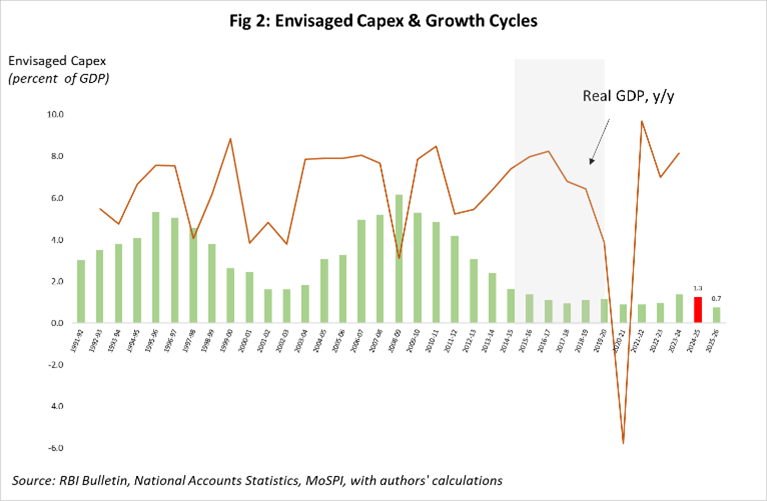
Compared to the 3-6 per cent range across business cycles in the mid-2000s, planned investments fell to about 1% of GDP or even lower since 2015-16. Moreover, the marginal post-pandemic rise in FY24-FY25 (to ~1.3% of GDP) slipped sharply this year to 0.7% of GDP (Yogindran et al., 2025).
This isn’t all. Increasingly, these investment plans are failing to reflect in actual capital formation. If around 40% of planned investments converted to tangible assets in the four decades up to 2011, only 15% have done so since then (Bhan et al., 2023). From 2016-17, it has stagnated at about 10%.
If around 40% of planned investments converted to tangible assets in the four decades up to 2011, only 15% have done so since then; from 2016-17, it has stagnated at about 10%. These trends raise an uncomfortable question: Is India witnessing more announcements than actual execution, a cycle of ‘paper optimism’ that is refusing to break ground?
CMIE data confirms these trends. Although private projects’ share in total investment announcement increased to 80% from 50-60% in the decade to 2022-23, project completion rates steadily declined from 2014 to just 9% in 2022-23, mirroring the trend seen in RBI’s data.
Altogether, these trends raise an uncomfortable question: Is India witnessing more announcements than actual execution, a cycle of “paper optimism” that is refusing to break ground?
Profits Without Investment
Could it be due to shifting expectations about returns on investment? Evidence points in that direction. Post-tax corporate profits of non-financial companies plunged after the 2007-08 financial crisis to 5.5% of GDP, and by 2019-20, collapsed to just 1%.
Could it be due to shifting expectations about returns on investment? Evidence points in that direction. Post-tax corporate profits of non- Breaking the Link Between Growth and Investment
Historically, investment plans have aligned with the business cycle, i.e. rising during booms and slowing on the downside. That link appears broken.
Historically, investment plans have aligned with the business cycle, i.e. rising during booms and slowing on the downside. That link appears broken. For example, even when real GDP grew 8.3% in 2016-17, the extent of investments maturing to actual did not change. There is no meaningful rise subsequently either. Why are even financially secure projects failing to see the light of the day? Several factors help explain this persistent inertia.
Is Financing the Missing Link?
Over time, large companies have increasingly relied on internal resources, foreign direct investment (FDI), and corporate bonds instead of traditional bank loans. This shift may partly explain the divergence between financial approvals and realised investments. However, data on overall financial flows to the commercial sector indicates the magnitudes are too small – bank credit constitutes about 47 % of total resources in the past 15 years, with FDI and bond financing averaging around one-quarter. Even when bank credit fell sharply following demonetisation or during the pandemic, alternate financing sources increased only marginally. Of late, even external financing, including commercial borrowing and FDI, has reversed.
financial companies plunged after the 2007-08 financial crisis to 5.5% of GDP, and by 2019-20, collapsed to just 1%. The story in manufacturing is no different – profits declined from 3.1 to 1.4% of GDP in the same period.
What companies did with their earnings further supports this trend. Rather than reinvest in capacity expansion, they increasingly chose to buy back shares or pay higher dividends. Illustratively, buybacks jumped from 16 issues in 2015-16 to nearly 50 per year in recent times, with a doubling of the dividend payout rate between 2018 and 2024. Corporate behaviour, therefore, indicates that firms increasingly perceive fewer profitable opportunities and, therefore, reward shareholders rather than build new factories or buy more machinery and equipment.
The Role of Expectations
If firms are reluctant to invest, why do their stated intentions remain high?
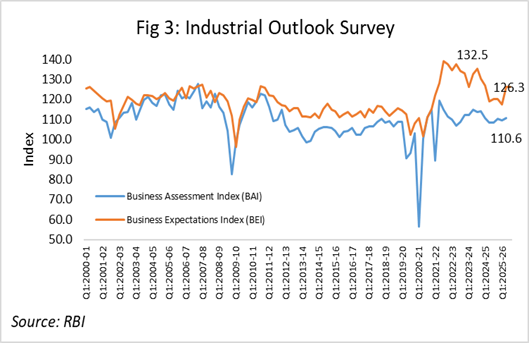
The answer may lie in over-optimistic expectations. Data from the RBI’s Industrial Outlook Survey, specifically the Business Assessment Index (BAI) and the Business Expectations Index (BEI), offer useful clues. Until 2012, the two moved closely together. Since then, however, expectations have persistently outpaced actual business conditions; the gap widened further after the pandemic. Optimism rose sharply even as output and capacity utilisation lagged (Figure 3).
This divergence suggests that firms often project confidence beyond their immediate conditions, partly to maintain a positive economic narrative that sustains investor sentiment. As Robert Shiller has argued, economic actors are influenced by compelling stories. Narratives about India’s reforms and growth potential may have inflated expectations more than real fundamentals warrant.
Drivers of Business Expectations
A deeper look into what drives business expectations explains why optimism often misfires.
Public declarations of fresh spending importantly contribute to the formation of an economic narrative, which often reflects the resurgence of enterprise, reinforcing the “animal spirits” described by Keynes. Yet such stories can blur the line between perception and reality, inflating investment plans that are later scaled back when economic outcomes disappoint. A high volume of financial approval may signal optimism, but it does not guarantee execution on the ground and tells us little about the economy’s real momentum.
At the peak of post-pandemic recovery (Q1 2021-22), the gap between expectations and assessment widened to nearly 30 points (Figure 3). While it has narrowed since, it remains elevated. Firms may be planning ambitious projects in anticipation of high growth, better infrastructure, and reform-driven improvements, an optimism that often borders on exuberance.
It is well known, for example, that public declarations of fresh spending play an important role in the formation of an economic narrative, which often reflects the resurgence of enterprise, reinforcing the “animal spirits” described by Keynes. Yet such stories can blur the line between perception and reality, inflating investment plans that are later scaled back when economic outcomes disappoint.
Figure 4 shows that for more than twenty years, changes in employment expectations (1.8 points), order books and production (-1.5 and -1.4 points) were the biggest contributors to business expectations (BEI). However, in the last decade, it is profit margins and finished goods’ inventories that have emerged as the most important drivers of fluctuations in business expectations (5.4 and -5.1 points respectively), followed by raw materials (-3.3 points). Export expectations are a key contributor (4.5 points) during this period. These trends suggest the growing role of external demand and corresponding adjustments of firms to volatility. Finally, overall business sentiments and fluctuations in slack or capacity utilisation are other important drivers.
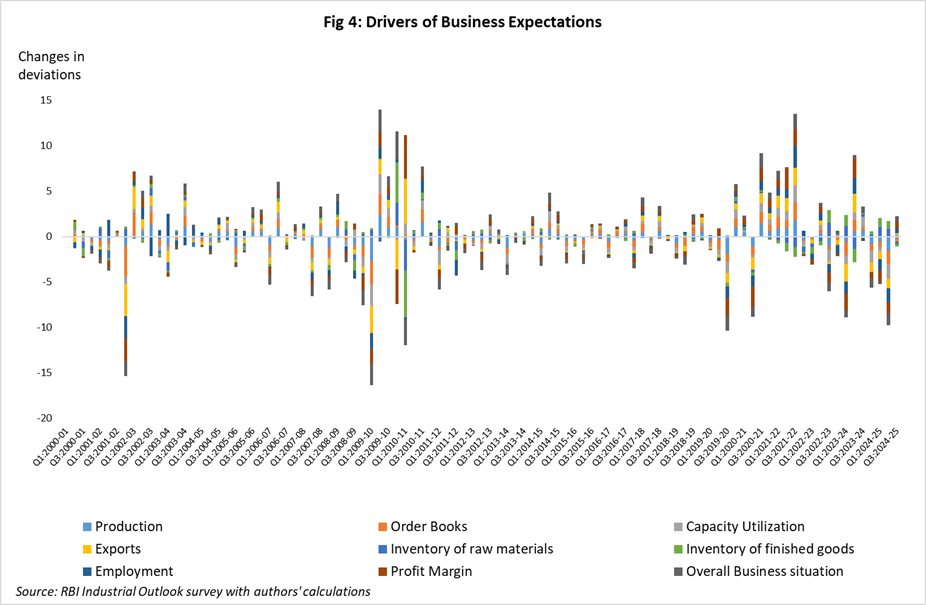
The outlook on profits and exports is usually volatile and, importantly, influenced by external factors. Temporary spikes in global demand or commodity prices can boost profit expectations, prompting firms to announce large capital expenditure plans in anticipation of sustained growth. However, when global or domestic demand weakens, these projects often lose financial viability, leading to cancellations or delays.
Indeed, BEI movements correlate strongly with nominal export growth since 2012, highlighting that business sentiments are sensitive to external trade conditions. This coincides with the collapse in world trade in 2011-12 and the decline in realised private investments.
The Policy Message From This Evidence is Clear.
First, financial approvals do not guarantee investment. A high volume of sanctioned projects may signal optimism, but unless these translate into execution on the ground, they tell us little about the economy’s real momentum. Second, profitability and risk perceptions matter for actual investments. Third, reviving private investment requires sustained demand, not just easier finance. With capacity utilisation rates indicating a peak last year and subdued external demand, firms may have little incentive to invest. Finally, while the government’s capex push encouraged private investment plans in the last two years, its impact appears to be fading, as indicated by the most recent data. Business investments are likely to be inspired by enduring demand certainty, a clear reason to expand.
(Adapted from Kohli & Bhapta, “Private Investment: Intentions versus Realisation,” Indian Public Policy Review, Vol. 5, No. 6, January 2025.)
FOOTNOTES
References
Bhan, S., Chavhan, R. N., & Kavediya, R. B. 2023. "Private Corporate Investment: Performance and Near-term Outlook". RBI, August 2023. https://rbi.org.in/Scripts/BS_ViewBulletin.aspx?Id=21995
Yogindran, S., Khandekar, S., Kavediya, R. B., & Ghosh, A. (2025, August). Private corporate investment: Growth in 2024–25 and outlook for 2025–26. RBI Bulletin. Reserve Bank of India. https://website.rbi.org.in/documents/d/rbi/augustbulletin2025
Renu Kohli
Kritima Bhapta


Find on this page
The Centre for Social and Economic Progress (CSEP) is an independent, public policy think tank with a mandate to conduct research and analysis on critical issues facing India and the world and help shape policies that advance sustainable growth and development.