CSEP sustainable mining attractiveness index: District-level study of Jharkhand
Reading Time: 28 minutesDOWNLOADS
Abstract
This paper introduces the concept of a Sustainable Mining Attractiveness Index to evaluate the mining sustainability in the districts of the Indian state of Jharkhand. While the state has extensive resources of coal and major minerals, it is one of the most impoverished states in the country. It ranks poorly on various metrics, including per capita gross state domestic product, the Sustainable Development Goals, the Human Development Index, and per capita power availability (despite being a major coal producer).
The National Mineral Policy 2019 emphasises the importance of environmental and social responsibility in mining, which is especially important given the numerous controversies surrounding the sector.
The Sustainable Mining Attractiveness Index, constructed for Jharkhand by the Centre for Social and Economic Progress, provides stakeholders with a holistic understanding of the potential of mineral resources-led development in the state; identifies factors that encourage and discourage mining investments; suggests government-led policy actions that enable sustainable mining jurisdictions; and provides mining companies benchmarks for guiding investment decisions.
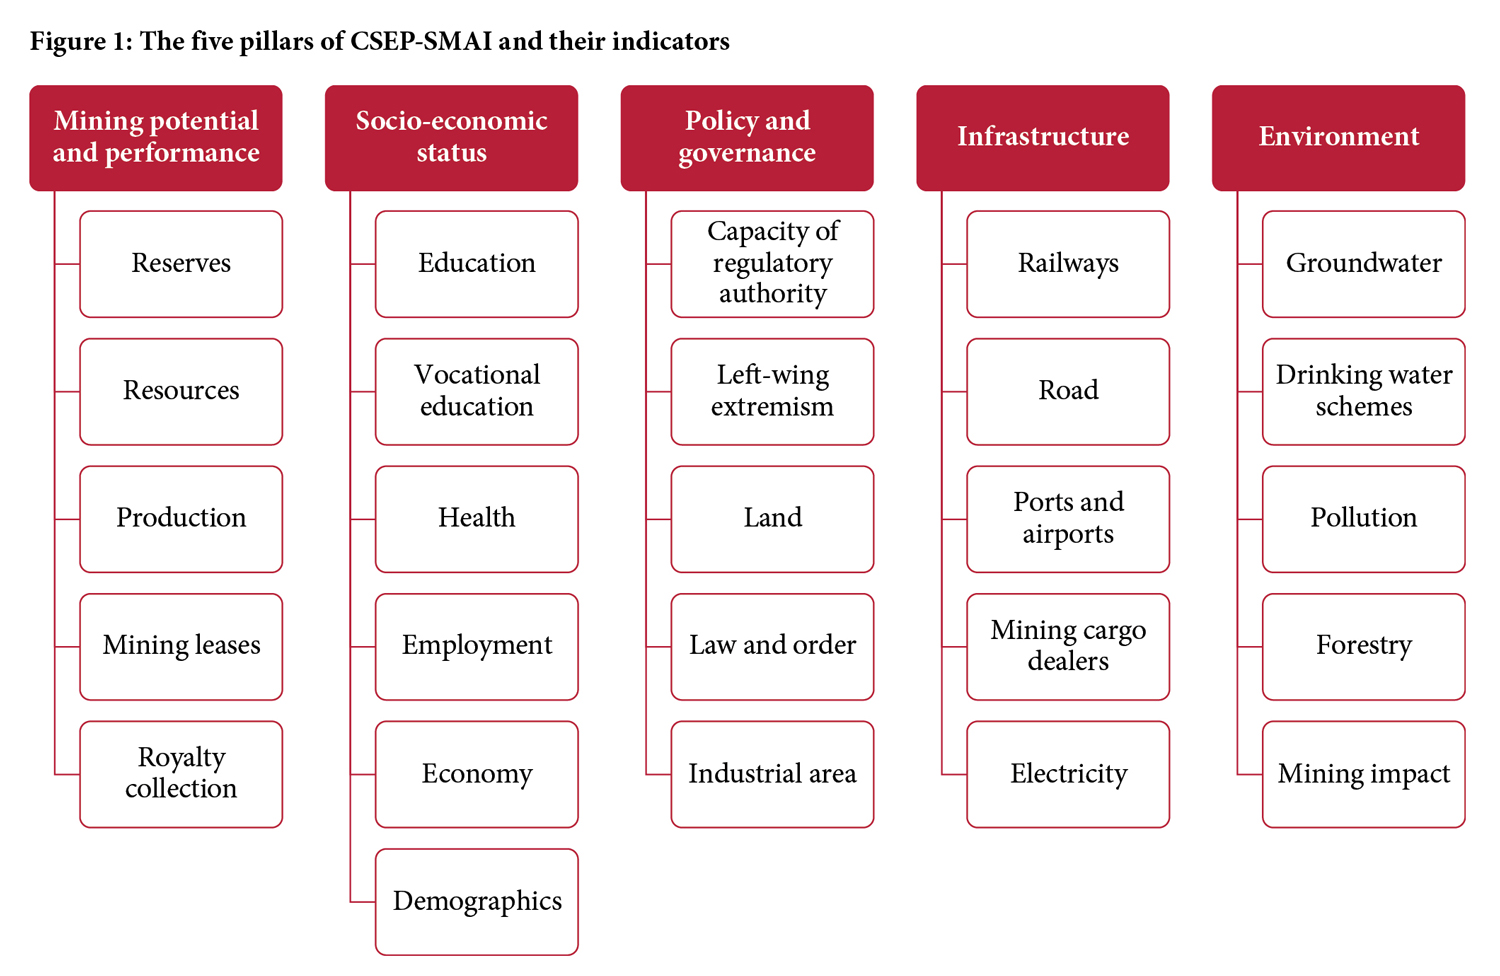
The Index has been constructed by evaluating the 24 districts of Jharkhand based on various secondary data normalised and aggregated under five pillars: (1) mining potential and performance; (2) socio-economic status; (3) policy and governance; (4) infrastructure; and (5) environment. The scores of the five pillars have been averaged to give each district a final sustainable mining attractiveness score and rank (Index).
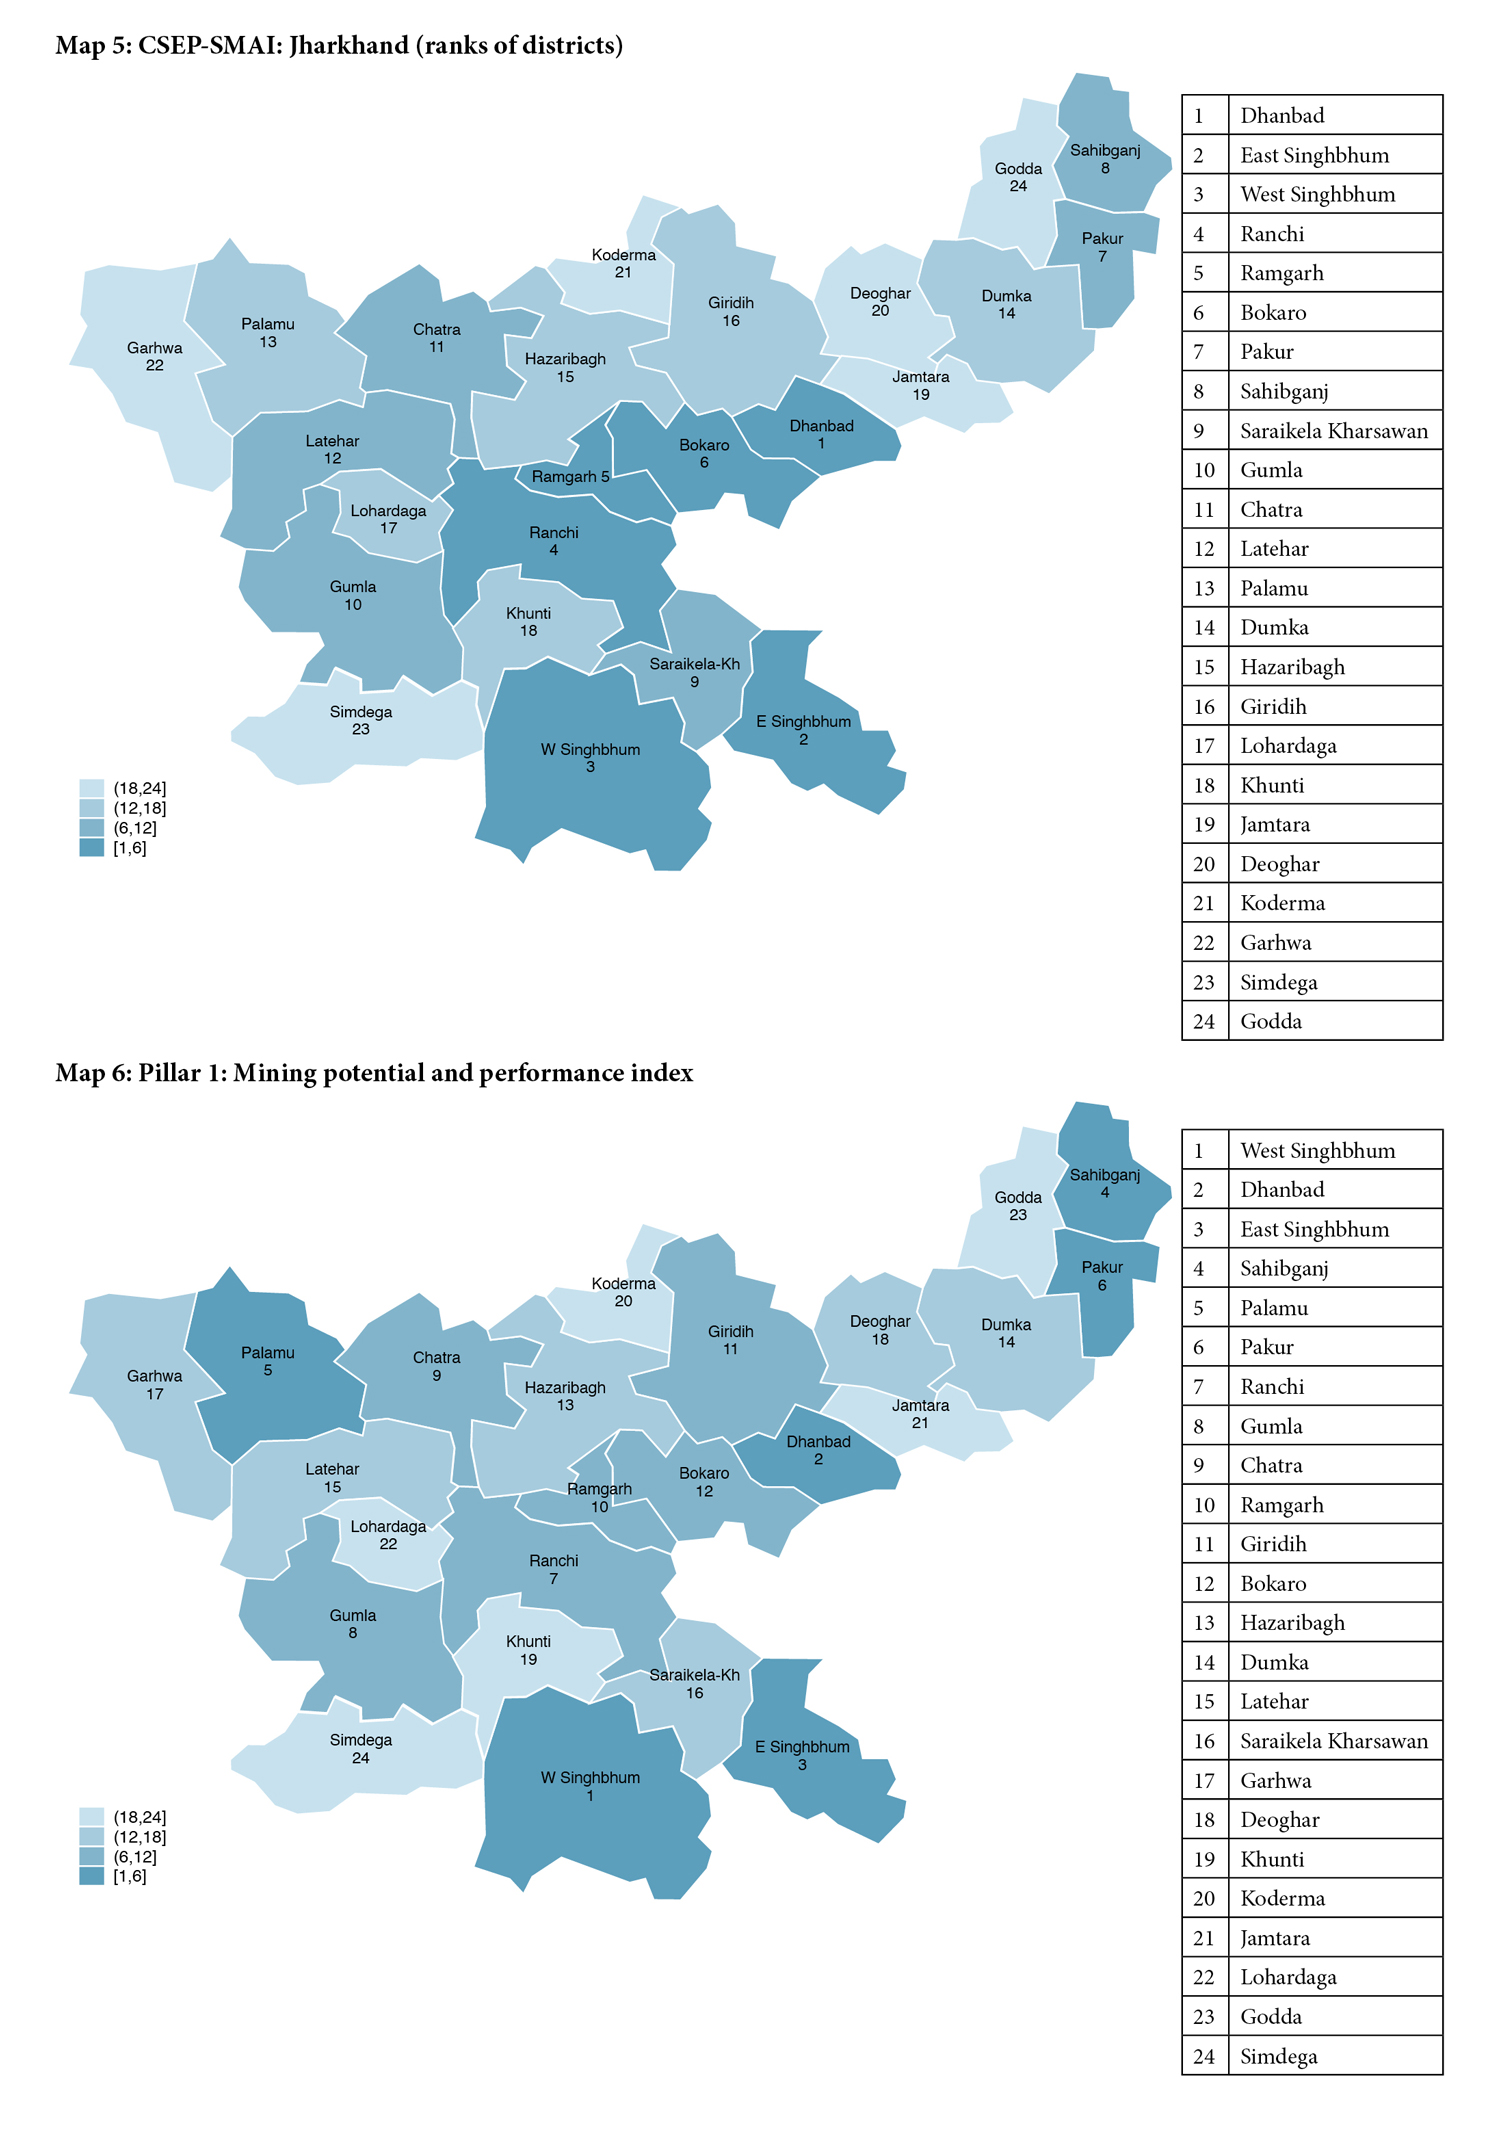
Dhanbad, East Singhbhum, and West Singhbhum have emerged as the top three districts. While they have performed well on mining potential and performance (ranking second, third, and first, respectively), they have not done as well on the environment and socio-economic status pillars.
Based on each district’s performance, this paper recommends policy focus areas to improve the attractiveness of these districts for sustainable mining.
Jharkhand: A mineral-rich state
The state of Jharkhand was part of Bihar until the year 2000. In November 2000, the Bihar Reorganisation Act carved out about 79,000 square kilometres (sq. km) from the erstwhile state of Bihar to form India’s twenty-eighth state, Jharkhand. Today, Jharkhand has a population of 38 million, and accounts for more than two-fifths of the mineral wealth of the country—including 27 percent of its coal resources, 26 percent of its iron-ore resources, and 18 percent of its copper ore resources (Planning-cum-Finance Department, 2020). It is the only Indian state which produces uranium, coking coal, and pyrite. It leads the country in the production of coal, mica, kyanite and copper, and produces close to one-fourth of the nation’s steel, including auto-grade categories.
Supported by Tata Motors, Jharkhand produces sophisticated auto components, including axles, shafts and radiators. The state has vast potential for industrialisation. The Indian Institute of Technology (Indian School of Mines) is located in Dhanbad, a major coal-producing district of Jharkhand. The underlying ecosystem for expanding mining does therefore exist, and can be expanded and improved upon relatively easily.
Poor in income and human development
Despite being rich in minerals, Jharkhand is one of India’s most impoverished states. Its per capita gross state domestic product (GSDP)—Rs 90,475 at current 2019–20 prices—is 37 percent below the national average, and its GSDP accounts for a mere 1.6 percent of India’s gross domestic product (GDP). In per capita GSDP terms, Jharkhand ranks 25 out of the 28 Indian states (Manipur, Uttar Pradesh, and Bihar rank below it). The Economic Survey of Jharkhand, 2019–20 (Planning-cum-Finance Department, 2020), reveals that during 2014–15 to 2019–20, while India’s GDP grew by 6.7 percent per annum, Jharkhand’s GSDP posted a lower growth at 6.2 percent per annum. In the same period, Jharkhand’s per capita GSDP grew at 4.5 percent per annum, compared to the national average of 5.7 percent per annum.
The United Nations Development Programme’s (UNDP) latest Subnational Human Development Index (HDI; for 2018) puts Jharkhand at 0.599, the third-lowest in India. Uttar Pradesh is slightly lower at 0.596, and Bihar at 0.576. The average HDI is 0.647 for India, with Kerala posting the highest value at 0.779. Jharkhand thus lies at the lower spectrum of the Medium HDI, which ranges from 0.500 to 0.699 (Global Data Lab, 2020).
NITI Aayog launched its Sustainable Development Goals (SDG) Index 2019–20 in December 2019. The Index is based on the quantitative progress of 16 out of 17 SDGs (the 17th SDG is based on a qualitative assessment—partnerships—to achieve the goal). According to this SDG Index, Jharkhand scored the second-lowest value of 53 and performed abysmally in six of the goals—SDG-1 No Poverty; SDG-2 Zero Hunger; SDG-4 Quality Education; SDG-5 Gender Equality; SDG-12 Responsible Consumption and Production; and SDG-13 Climate Action (Niti Aayog, 2019)
Despite being a coal-rich state, Jharkhand has the lowest per capita power availability—938 kilowatt-hours (kWh) in 2018–19—compared to the national average of 1,181 kWh in the same period. The corresponding values for two other mining-rich states—Chhattisgarh and Odisha—are 1,961 kWh, and 1,628 kWh, respectively (Press Information Bureau, 2019).
Overall, therefore, Jharkhand is among the more socio-economically backward states in India and needs to invest in infrastructure and services that are more accessible. Resources being a major constraint, its mining economy can help generate surpluses for all-round investment in the state’s inclusive growth.
The rest of this paper is as follows. Section 2 provides a discussion on the growth and development of Jharkhand with mining as the focus sector. Section 3 portrays the mineral inventory in the state’s 24 districts. The objectives of this study are outlined in Section 4. Details on the methodology of the study and its data sources are described in Sections 5 and 6, while Section 7 discusses the five pillars used to index the districts for their mining attractiveness. The results of the study are presented in Section 8, and the policy implications in Section 9.
With its vast reserves and mineral development potential, Jharkhand’s mining sector can create the necessary momentum for sustained and inclusive growth in the state and the country. The sector is tied to several key industrial sectors such as steel, cement, fertilisers, chemicals, and electronics, providing the raw materials. If supported by State government policy, Jharkhand’s mining sector can become a key driver towards achieving the Government of India’s vision of a $5 trillion national economy by 2025.
Sustainable mining is especially important considering the controversies that the mining sector has been embroiled in, which has affected its economic performance. Moreover, environmental and social liabilities are increasingly becoming an area of focus among businesses, including those in the mining sector. The new National Mineral Policy (NMP) proposed by the Government of India in 2019, lays much emphasis on proper ‘exploration’, ‘streamlining regulatory mechanisms’, and on operating with the utmost environmental and social responsibility. The NMP envisions India doubling its production of major minerals by 2025 and reducing its trade deficit in the sector by 50 percent.
This paper focuses on ranking (indexing) the districts of Jharkhand as per their sustainable mining potential. The paper indexes not just the mining potential of the district, but also the socio-economic, environmental, infrastructural, and governance considerations critical to sustainability and business operations. While the indices are the outcome of the study, perhaps much more important is identifying and quantifying gaps that prevent each district from achieving its full potential.
The findings and outcomes are based on a collection of secondary data on the ‘five pillars of sustainable mining’—(1) mining potential and performance; (2) socio-economic status; (3) policy and governance; (4) infrastructure; and (5) environment. All 24 districts have been scored on each pillar, and the aggregate scores of each district have also been computed. The findings will enable informed decision-making on policy, on new and ongoing mining investments, and on operational viability within mining districts.
The computation of such a district-level Sustainable Mining Attractiveness Index (SMAI) provides an overall understanding of each district’s preparedness for facilitating responsible mining operations, including the shortcomings that exist at present. The ‘CSEP-SMAI: Jharkhand’ is thus a comprehensive snapshot of the state’s mining environment. It includes policy recommendations to improve the mining sector state-wide, along with socio-economic and environmental outcomes.
Jharkhand: Mineral inventory
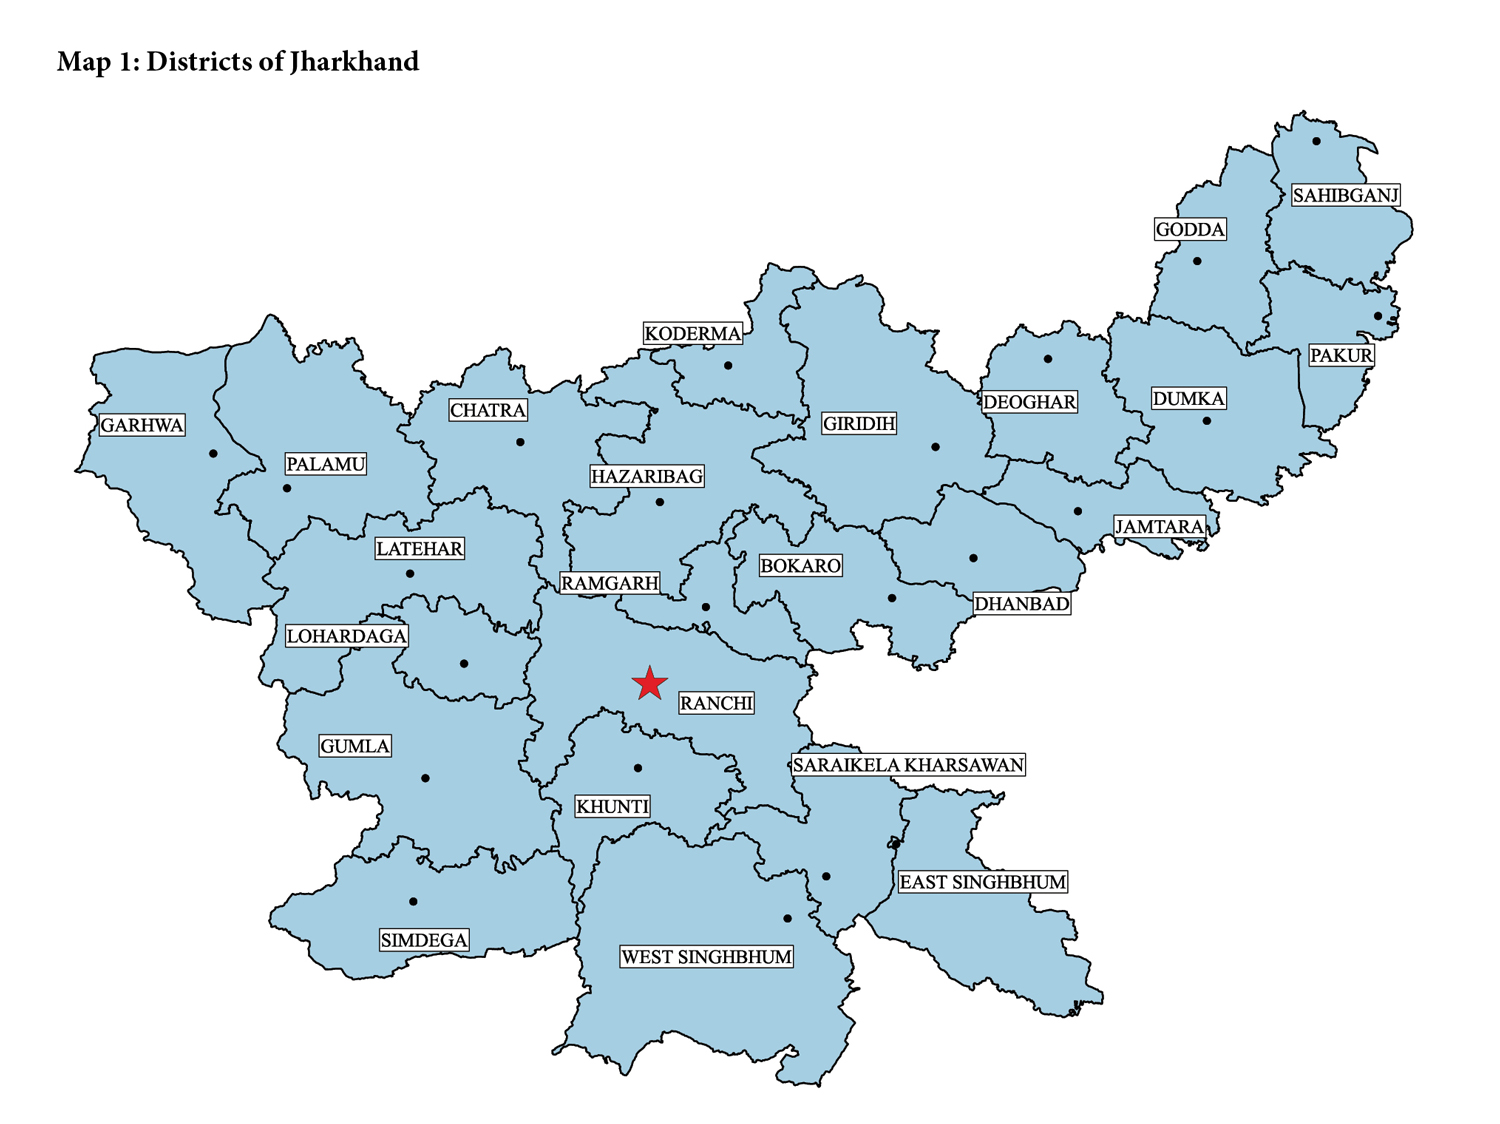
Mining in Jharkhand includes coal and non-fuel mining of major and minor minerals.[1] Mining activity differs across all 24 districts (see Map 1). Thirteen districts—Bokaro, Chatra, Deoghar, Dhanbad, Giridih, Godda, Hazaribagh, Jamtara, Latehar, Pakur, Palamu, Ramgarh, and Ranchi—account for about 26 percent of the total coal inventory in India. In 2018–19, these districts produced 18.5 percent of the total production of coal in the country (Coal Controller’s Organisation, 2020).
Besides coal, resources of other non-fuel minerals in Jharkhand include bauxite, copper ore, graphite, iron ore, kyanite, gold, limestone, and manganese ore (Indian Bureau of Mines, 2019). The significant non-fuel mineral reserves are distributed across districts as follows:
- Bauxite: Dumka, Gumla, Latehar, Lohardaga and Palamu districts have reserves, but only Gumla, Latehar and Lohardaga districts were producing bauxite in 2018–19. Primary exploration for bauxite and other associated minerals was carried out in Gumla district in 2017–18.
- Copper: East Singhbhum and Hazaribagh districts have reserves of copper ore. In 2018–19, only East Singhbhum was producing copper in the state. Further exploration is underway.
- Graphite: Palamu is the primary source of graphite in Jharkhand, but there are some reserves in Latehar district too. In 2018–19, graphite was produced in both Latehar and Palamu districts. Further exploration of the mineral is being done in Ranchi and Palamu districts.
- Iron ore: Available and produced only in West Singhbhum, where there is ongoing exploration for new iron ore resources.
- Kyanite: Reserves are found in West Singhbhum and Seraikela Kharsawan districts, but there was no production and exploration done in 2017–18.
- Limestone: Reserves are found in nine districts (Bokaro, Dhanbad, East Singhbhum, Garhwa, Giridih, Hazaribagh, Palamu, Ranchi and West Singhbhum). Of these nine, only West Singhbhum reported production of limestone in 2018–19. Exploration of the mineral is being carried out in Garhwa and Ranchi.
- Manganese ore: There is potential in East and West Singhbhum districts, but only West Singhbhum district produced manganese ore in 2018–19.
- Gold ore: East Singhbhum has reserves of gold ore and produced 2,134 tonnes of gold ore in 2018–19.
Eight districts (Bokaro, Chatra, Dhanbad, Godda, Hazaribagh, Palamu, Ramgarh and West Singhbhum) out of the 24 have significant mining activity. These eight districts accounted for 34 percent of the state’s geographical area, 40 percent of its population and 87 percent of its mineral royalties in 2018–19.
Three districts (Khunti, Koderma and Simdega) do not have reserves or resources of major minerals. Of these three, Simdega has no reserves of minor minerals (other than sand and stone) but has some resources of granite, while Khunti has no reserves or resources of minor minerals (other than sand and stone).
CSEP-SMAI: Objectives
The CSEP-SMAI abides by the principle that mining should benefit the economy, improve livelihoods in local communities, be environmentally responsible, and remain economically viable for the mining companies.
The purpose of the survey and this paper is to provide stakeholders with a holistic understanding of the potential of mineral resources-led development; identify factors that encourage and discourage mining investments; suggest government-led policy actions that enable sustainable mining jurisdictions; and, provide mining companies benchmarks for guiding investment decisions.
As discussed in Section 2, the paper analyses the performance of the 24 districts under the following five pillars: (1) mining potential and performance; (2) socio-economic status; (3) policy and governance; (4) infrastructure; and (5) environment.
Each pillar has five indicators, except for socio-economic status, which has six indicators. Each indicator has multiple sub-indicators, which are normalised to make them unit-free, falling in the range of 0 to 100 (where 100 represents the best performing district, and 0 the worst).
All five pillars are given equal weight when calculating the overall CSEP-SMAI score. The weighted geometric mean is used to calculate the final score. Details of the indexing method and the weighting diagram are given in Annex-B.
This pioneering CSEP-SMAI study has drawn upon methodologies used by other institutions and agencies, both Indian and international, to determine opportunities and barriers for mining investments, and to undertake sustainable mining in various jurisdictions. The approaches under consideration include the Annual Survey of Mining Companies by Fraser Institute (Canada) (Stedman, Yunis, & Aliakbari, 2020), and the State Investment Potential Index by the National Council of Applied Economic Research (NCAER) (National Council of Applied Economic Research, 2018).
The five pillars: Various secondary sources have been used for getting information on the five pillars (mentioned above) of the CSEP-SMAI. These sources include government data and reports, legislation and regulation, and other papers and reports published by accredited agencies. A detailed list of sources may be found in Annex A.1.
Coal: Some of the critical data required for the computation of CSEP-SMAI—such as district-level data on coal reserves, resources, and production—are not available. The Coal Directory of India 2018–19 provides information on state-wise and coalfield-wise reserves and resources, as well as company-wise and state-wise production of coal (Ministry of Coal, Government of India, 2020).
Information on the area of each coal mine (in hectares) and the leaseholder’s name is available on the website of the Department of Mines and Geology (DMG), Jharkhand (Department of Mines & Geology, Government of Jharkhand, 2020). Using this, along with the ‘production by leaseholder’ data (taken from the Coal Directory of India), coal production values have been divided by district, in the ratio of the area of the mines. This assumes that each of the coal mines produces the same amount of coal per sq. km of the area of the mine.
In order to estimate the reserves and resources of coal by district, the locations of Jharkhand’s coalfields were mapped. The coal reserves and resources were apportioned based on the districts the coalfield spanned and the area of those districts.
Minerals and ores: Data for production of major minerals was available, but the data for production of minor minerals is not published by the Indian Bureau of Mines (IBM) or DMG, Jharkhand. Instead, the number of minor mineral mines was used as an indication of the production value of minor minerals. These mines were divided into two categories: sand and stone mines; and other minor mineral mines. This division is required since the IBM does not provide information on reserves or resources for sand and stone.
These sand and stone mines make up the maximum number of minor mineral mines in the state and hence, are important indicators of mining activity in the district. The underlying assumption is that each minor mineral mine produces the same (average) amount of minor minerals.
CSEP-SMAI pillars and their indicators
The CSEP-SMAI study involves quantitative and qualitative evaluation of several factors that are central to the mining sector’s business attractiveness and economic viability. The study is based on the five pillars, each having several indicators (see Figure 1). A comprehensive list of sub-indicators and data sources is given in Annex A.1.
Mining potential and performance
The mining potential of a district refers to the documented values of its reserves and resources of coal and non-fuel minerals. The number of mining leases (working mines in particular), as well as the mineral production, are indicators of the district’s ongoing mining performance.
Mineral resources, reserves, and production: The United Nations Framework Classification (UNFC) of mineral reserves and resources considers three dimensions—geological assessment, feasibility assessment and economic viability. It defines a mineral reserve as the economically mineable part of a measured and/or indicated mineral resource (Indian Bureau of Mines, 2009). The production of ores indicates how well the resources and reserves were explored and mines were made operational.
As discussed in Section 3, districts with significant coal reserves include Dhanbad, Ramgarh, Hazaribagh, Sahibganj, Ranchi, Chatra and Bokaro. Substantial reserves of bauxite are found in Gumla, Lohardaga and Palamu districts. Copper and gold reserves are found in East Singhbhum (it is the only district to have gold reserves), manganese, limestone and iron-ore reserves in West Singhbhum, and significant limestone reserves are in Garhwa and Palamu. Almost all the districts are endowed with reserves of minor minerals. Gumla and Lohardaga are two important bauxite producing districts.
Mining leases and working mines: It is a matter of grave concern that only 22 percent of the 3,825 mining leases in Jharkhand are currently operational, implying substantial underutilised investments in the mining sector. Sahibganj has the highest number of mining leases (419), followed by Pakur (339), Dhanbad (267), Dumka (245), and Giridih (209).
Godda, Koderma and Lohardaga have the lowest shares of working mines at 12 percent each. Ranchi and West Singhbhum are just a little better, at 13 percent. The share of working mines is high in Latehar (43 percent), Palamu (39 percent), and Dhanbad (35 percent).
Dhanbad and West Singhbhum provided the highest royalty revenues in 2018–19, contributing 23 percent and 21 percent, respectively, to the total state collection of Rs 5,978 crore.
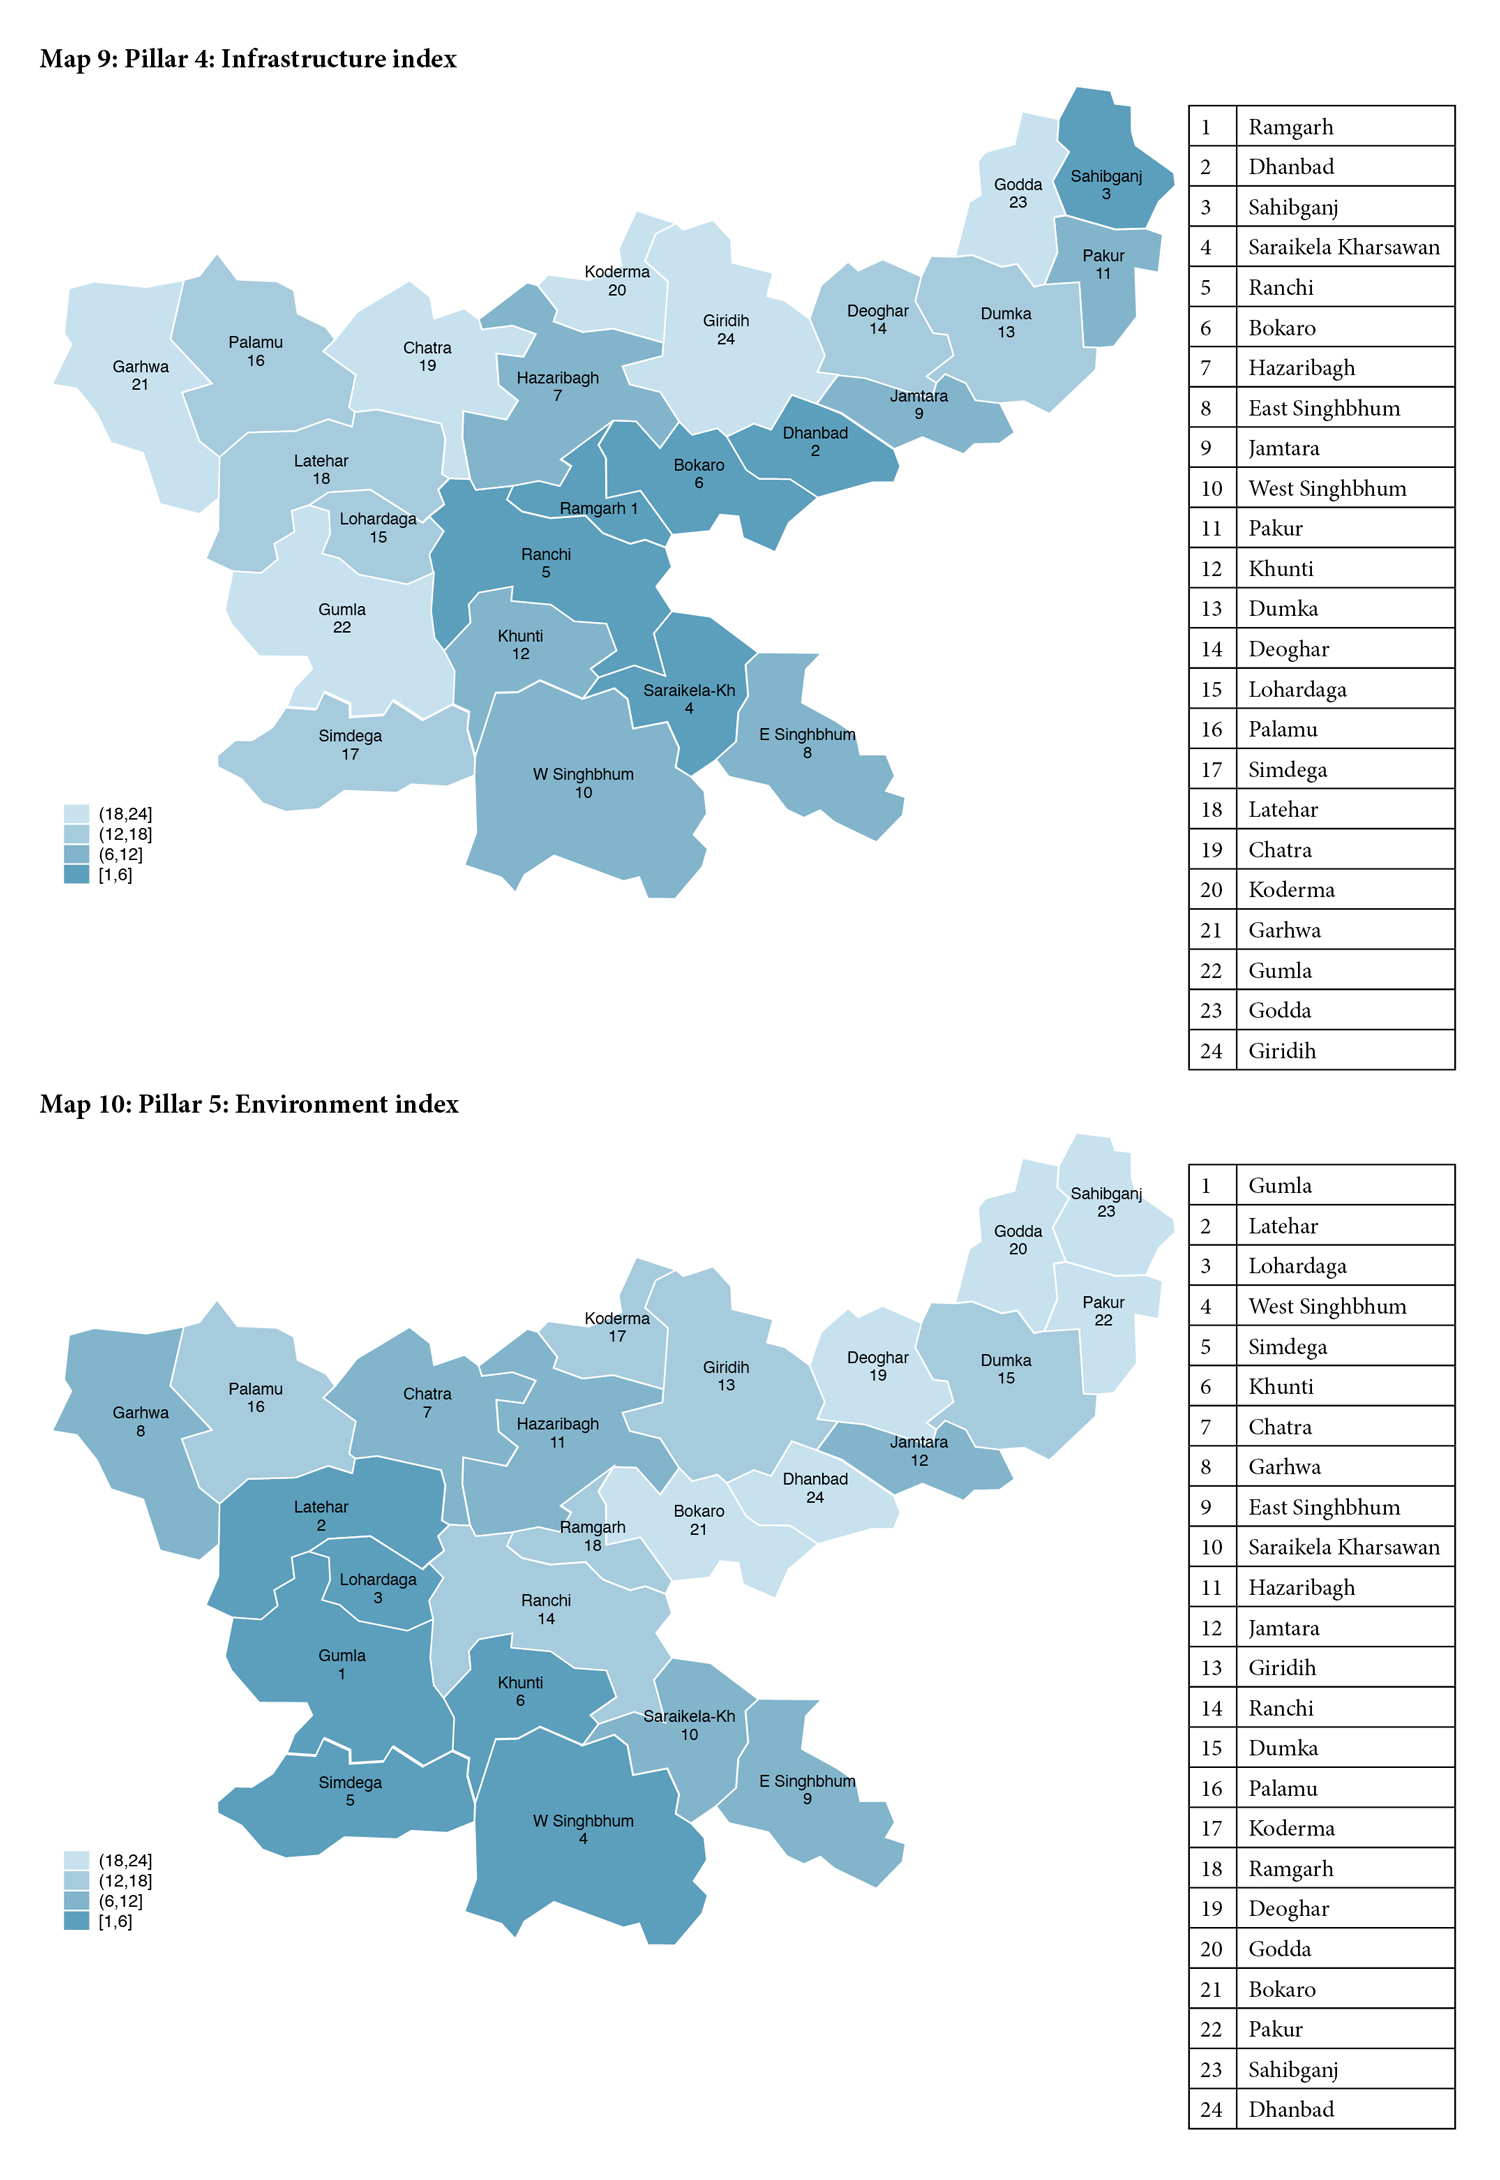
Socio-economic status
While it is essential to make the best use of each district’s mining potential, it is equally desirable to relate this to the district’s socio-economic status and progress. District socio-economic status is gauged by measuring performance on various sub-indicators, including per capita income, demographics in terms of the sex ratio, labour force participation rate (LFPR), participation by women in the workforce, and outcomes in education and health.
Per capita income: The latest district-level data available is for 2008–09, and shows Bokaro, Dhanbad, East Singhbhum, Pakur and Sahibganj as high per capita income districts, while Godda, Garhwa, Latehar, Palamu and Simdega lie at the lower end of the spectrum.
Sex ratio (females per 1,000 males): Data was available for 2015–16 and reveals that the sex ratio is above 1,000 in the state. However, nine districts—Bokaro, Deoghar, Dhanbad, Jamtara, Khunti, Palamu, Ranchi, Sahibganj and Seraikela Kharsawan—show a sex ratio of less than 1000, with the lowest being Dhanbad and Seraikela Kharsawan (947 each).
LFPR: Jharkhand’s LFPR stood close to 45 percent in 2017–18, and more than 50 percent in Bokaro, Chatra, Giridih, Gumla, Jamtara, Latehar and Pakur. Among these high-performing districts, Gumla (61 percent) and Jamtara (54percent) fared the best. Five districts—Deoghar, Dumka, Hazaribagh, Koderma and Palamu—posted an LFPR of 40 percent or less, and Koderma and Hazaribagh (both 26 percent), were the lowest.
Participation of women in the workforce: This stands at about 15 percent overall, with 10 of the 24 districts reporting a participation rate of less than 10 percent—the lowest being Godda (2 percent), followed by Dumka, Koderma and Latehar (4 percent each). A more positive scenario was seen in Gumla, Jamtara, Khunti, Bokaro, Giridih, and Ranchi—with each reporting rates of more than 20 percent. Gumla reported the highest rate (47 percent), followed by Jamtara (39 percent), and Khunti (37 percent).
Literacy rate: The level of education of the people at the district level is an essential indicator of labour productivity. While the NSS 75th Round (July 2017–June 2018) indicates comparable levels of educational achievement in many districts of Jharkhand, five districts (Sahibganj, Pakur, Lohardaga, Khunti, and Chatra), have the lowest literacy rates in the state (Ministry of Statistics and Programme Implementation, Government of India, 2020).
Health: Unlike in education, where achievements are fairly uniform, there are stark differences among districts in health achievements. Health indicators include maternal and infant mortality, anaemic women in the age group of 15–49, and stunted, wasted, and underweight children below the age of five. Findings are abysmal in the seven districts of Dumka, Gumla, Khunti, Latehar, Lohardaga, Simdega and West Singhbhum, but are far better in another seven districts—Bokaro, Dhanbad, Giridih, Godda, Koderma, Palamu and Ramgarh.
Policy and governance
Mining companies prefer jurisdictions that have supportive policies and good governance. While many policies and governance issues are common across the districts of a state, some factors are idiosyncratically aligned with districts—such as, the capacity of the regulatory authorities, left-wing extremism, law and order, land records, and land under industrial area.
Capacity of regulatory authority: The distance from district headquarters to the nearest state pollution control board (SPCB) office is a proxy for the capacity of the regulatory authority. Eight districts in Jharkhand—Bokaro, Deoghar, Dhanbad, Dumka, East Singhbhum, Hazaribagh, Pakur, Ranchi and West Singhbhum—have an SPCB located at their respective headquarters. However, three districts are overseen by SPCBs that are quite a distance away—Garhwa (209 km), Palamu (173 km), and Sahibganj (166 km).
Left-wing extremism: This has adversely affected local communities and normal business operations in the past. However, the study found that the frequency of adverse incidents caused by left-wing extremism has fallen sharply in Jharkhand—from 537 in 2008–2015 (66 cases per year), to 166 during 2016–2020 (33 cases per year).
The total number of cases from 2008 to 2020 stand at 703: the worst suffering districts being Gumla (100 cases), Khunti (80 cases), Latehar (70 cases), Palamu (55 cases), and West Singhbhum (53 cases). Data shows that the districts of Deoghar, Godda, Jamtara, Koderma, and Sahibganj have been nearly free of such incidents—only two incidents or less in the last 13 years.
Law and order: Police deployment and the maintenance of law and order are critical to the smooth functioning of business operations and the safety of local communities. Jharkhand witnessed 165 cognisable crimes per lakh population (crime rate) in 2019. Data reveals a relatively high crime rate in the districts of Sahibganj (319), Ranchi (265), Garhwa (264), Deoghar (231), and Hazaribagh (208). The three districts that have much lower crime rates are Pakur (90), Simdega (85) and West Singhbhum (70).
The distribution of police stations per million persons is quite uneven across districts and is 13 per million population on average. Lohardaga, Simdega and West Singhbhum have a relatively higher number of police stations per million persons, as opposed to districts like Deoghar, Dumka, Giridih, Godda and Gumla, Koderma, Palamu, and Ramgarh.
Land records: Valid land ownership records are a significant attraction that draws business investment. Nineteen districts in Jharkhand have more than 90 percent cadastral maps linked to the record of rights. The coverage in the remaining five districts varies widely from 86 percent in Ranchi, to just 1 percent in Hazaribagh.
Land under industrial area: The Jharkhand Industrial Area Development Authority (JIADA) manages the development of industrial land in the state, which includes developing facilities in these areas (such as water supply and electricity), with the goal of attracting new industries and facilitating the ease of doing business. There are currently four regional offices of JIADA, located in Adityapur (for East Singhbhum and Saraikela Kharsawan), Bokaro (for Bokaro and Dhanbad), Santhal Pargana (for Sahibganj, Deogarh, Dumka, Jamtara, and Godda), and Ranchi (for Ranchi, Khunti, Ramgarh, Lohardaga, Gumla, Palamu, Hazaribagh, and Koderma). All districts—barring Chatra, Pakur, and Simdega—have some industrial area plots available.
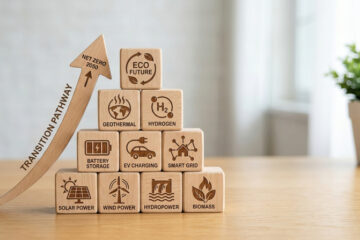
Infrastructure
Infrastructure provides logistics support to business operations and mining operations are no different. As Jharkhand is a landlocked state, a district with adequate rail, road, air, and seaport connectivity is preferred to set up businesses. The presence of mining cargo dealers and power availability are yet other essential determinants.
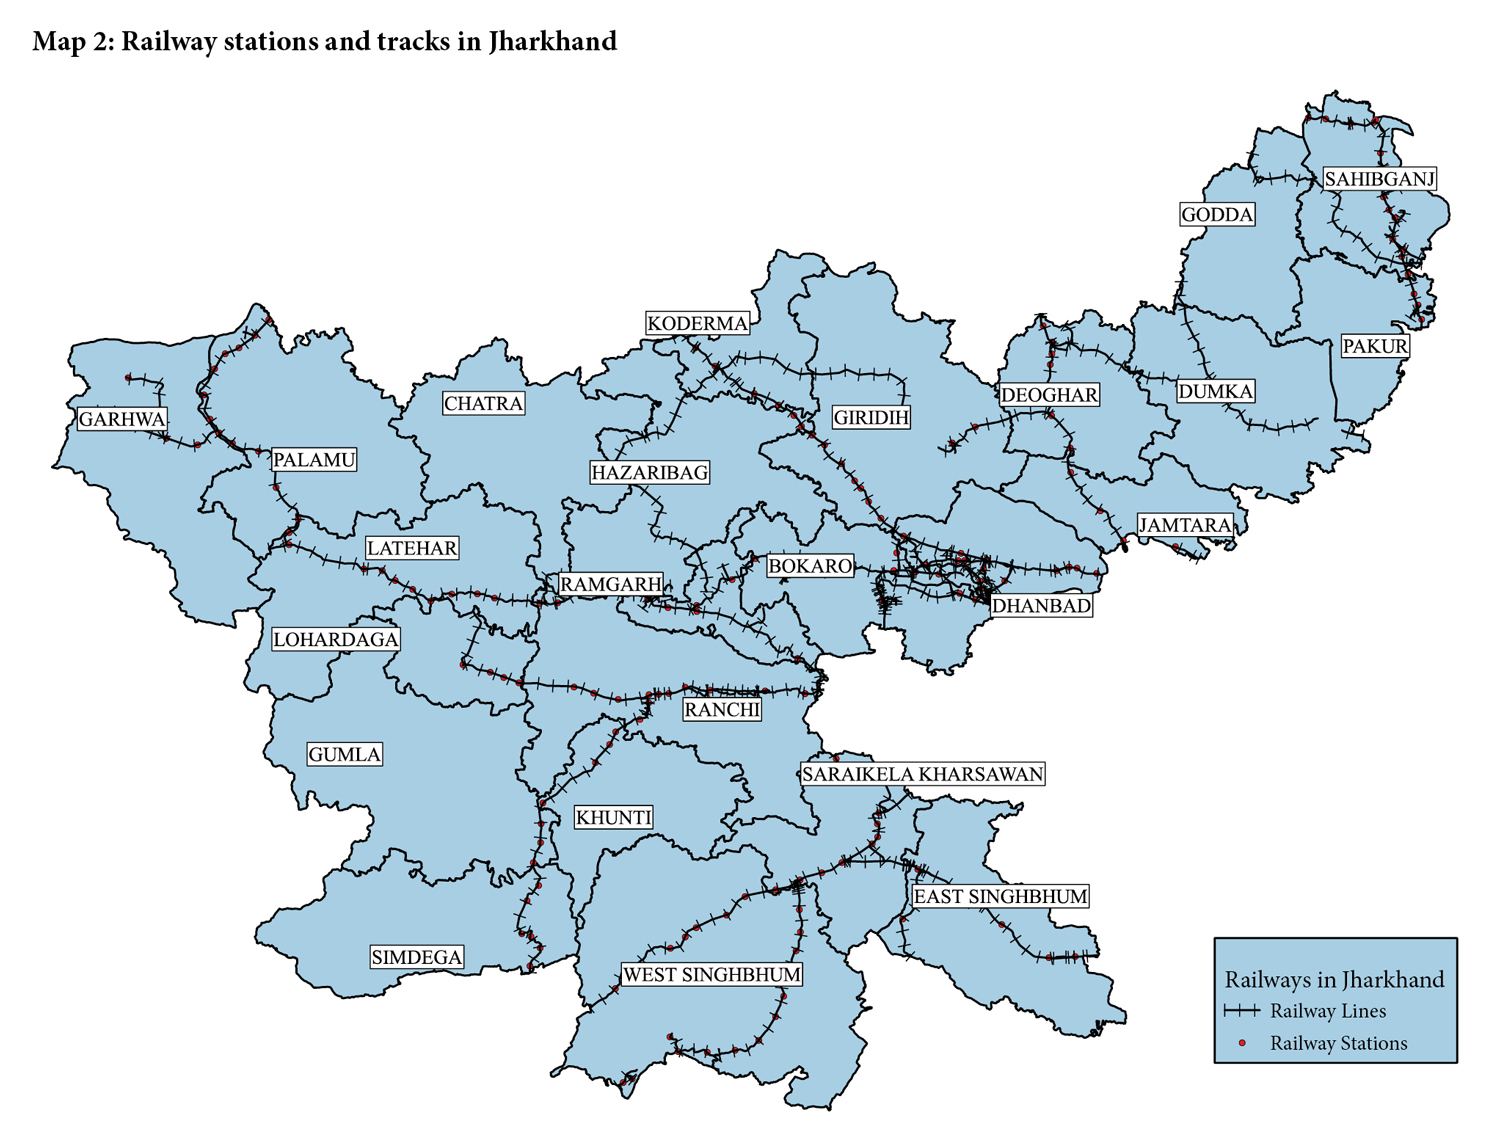
Rail connectivity: The railway density in Jharkhand is 35 km per 1000 sq. km. The districts of Dhanbad, Ramgarh, Sahibganj, and Bokaro have higher railway density, especially Dhanbad at 141 km and Ramgarh at 120 km per 1000 sq. km. Railway density is low (under 10 km per 1000 sq. km) in the districts of Gumla and Chatra.
Road connectivity: The average density of national highways in Jharkhand is 31 km per 1000 sq. km. The density is relatively high in Dhanbad, Hazaribagh, Deoghar, and Ranchi, with Dhanbad at 66 km and Hazaribagh at 59 km per 1000 sq. km. The average density of the state highways is 28 km per 1000 sq. km. Districts with a high density of state highways include Ramgarh, Deoghar, Ranchi, Palamu, Khunti, and Latehar—with Ramgarh at 51 km and Deoghar at 48 km per 1000 sq. km. Godda has just 2 km per 1000 sq. km of state highways, making it the worst-performing district in this sub-indicator.
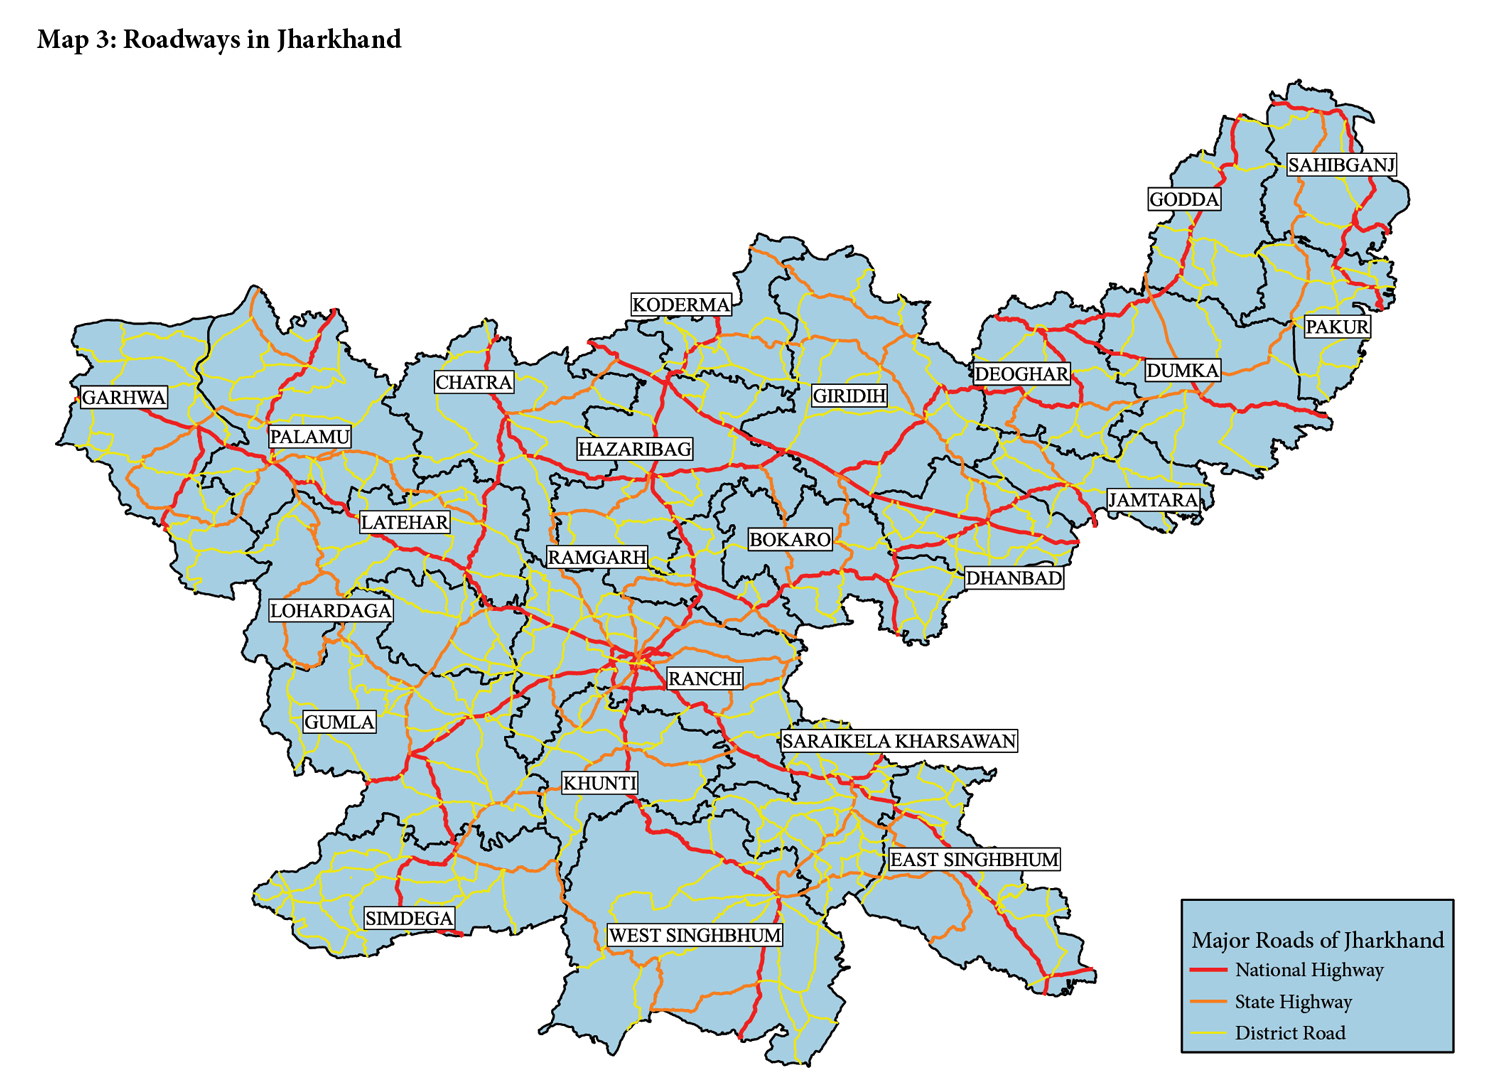
Saraikela Kharsawan has the highest road density, followed by Simdega and Dhanbad, while Godda has the lowest road density. Ramgarh has, by far, the highest density of city and village roads, followed by Deoghar and Hazaribagh, with Dumka and Sahibganj performing the worst.
Distance from the nearest airport (domestic and international): As Jharkhand is a landlocked state without a seaport of its own, access to airports becomes an even more essential requirement for businesses. However, only the state capital, Ranchi, has an airport (the Birsa Munda Airport) and caters to domestic flights. The state does not have an international airport as of now and the remaining districts do not have easy access to an airport. Thus, Ranchi is the main point of access to and from Jharkhand by commercial airlines. The two nearest airports to Jharkhand are Patna (in Bihar) in the north and Kolkata (in West Bengal) in the east.
Mining cargo dealers: Cargo dealers provide critical support for storage, trading and processing activities. On average, there are 31 mining storage depots, 117 mining traders and 144 processing units per district in Jharkhand.
Storage depots: Four districts—Dumka, Hazaribagh, Koderma and Sahibganj—have a high concentration of storage depots. Sahibganj is a central hub with 253 storage depots.
Mining traders: Ramgarh, with 1,023 mining traders, is the hub, though there are a large number of mining traders in Bokaro, Chatra, Deoghar, Dhanbad and Hazaribagh as well.
Mining processing units: Again, Ramgarh is the hub, with 1,233 active processing units. Other districts with many mining processing units are Dhanbad, Pakur, and Palamu.
Power availability: The data on rural power availability shows variations across districts. Giridih and Godda get lower power availability compared to most other districts.
Environment
Environment conservation is an essential component of sustainable mining. Issues of importance include groundwater availability and consumption, availability of safe drinking water, pollution caused by particulate matter (PM) 2.5 in the air, protection of forest cover, and mining wastelands.
Groundwater: The average district-level availability of groundwater was found to be 156 cubic metres (cu. m) per annum, with an average utilisation rate of 26 percent. Chatra, Khunti, Lohardaga and Simdega have relatively high per capita water availability. Simdega, at 452 cu. m, has the highest estimated per capita water availability.
Safe drinking water: Schemes run by the state’s Department of Water and Sanitation, under the National Rural Drinking Water Programme, stand at an average of 14 schemes per 1,000 people; the districts with the most schemes per 1,000 people are Dumka, East Singhbhum, Gumla and Sahibganj (more than 24 schemes each). Chemicals contaminate an average of 24 percent of drinking water sources in Jharkhand. East Singhbhum, Ranchi, Sahibganj and Simdega suffer from relatively high shares of contaminated drinking water sources.
PM 2.5 pollution levels: Godda and Sahibganj suffer from relatively high levels of PM 2.5 concentration, while Gumla and West Singhbhum have the lowest PM 2.5 concentrations.
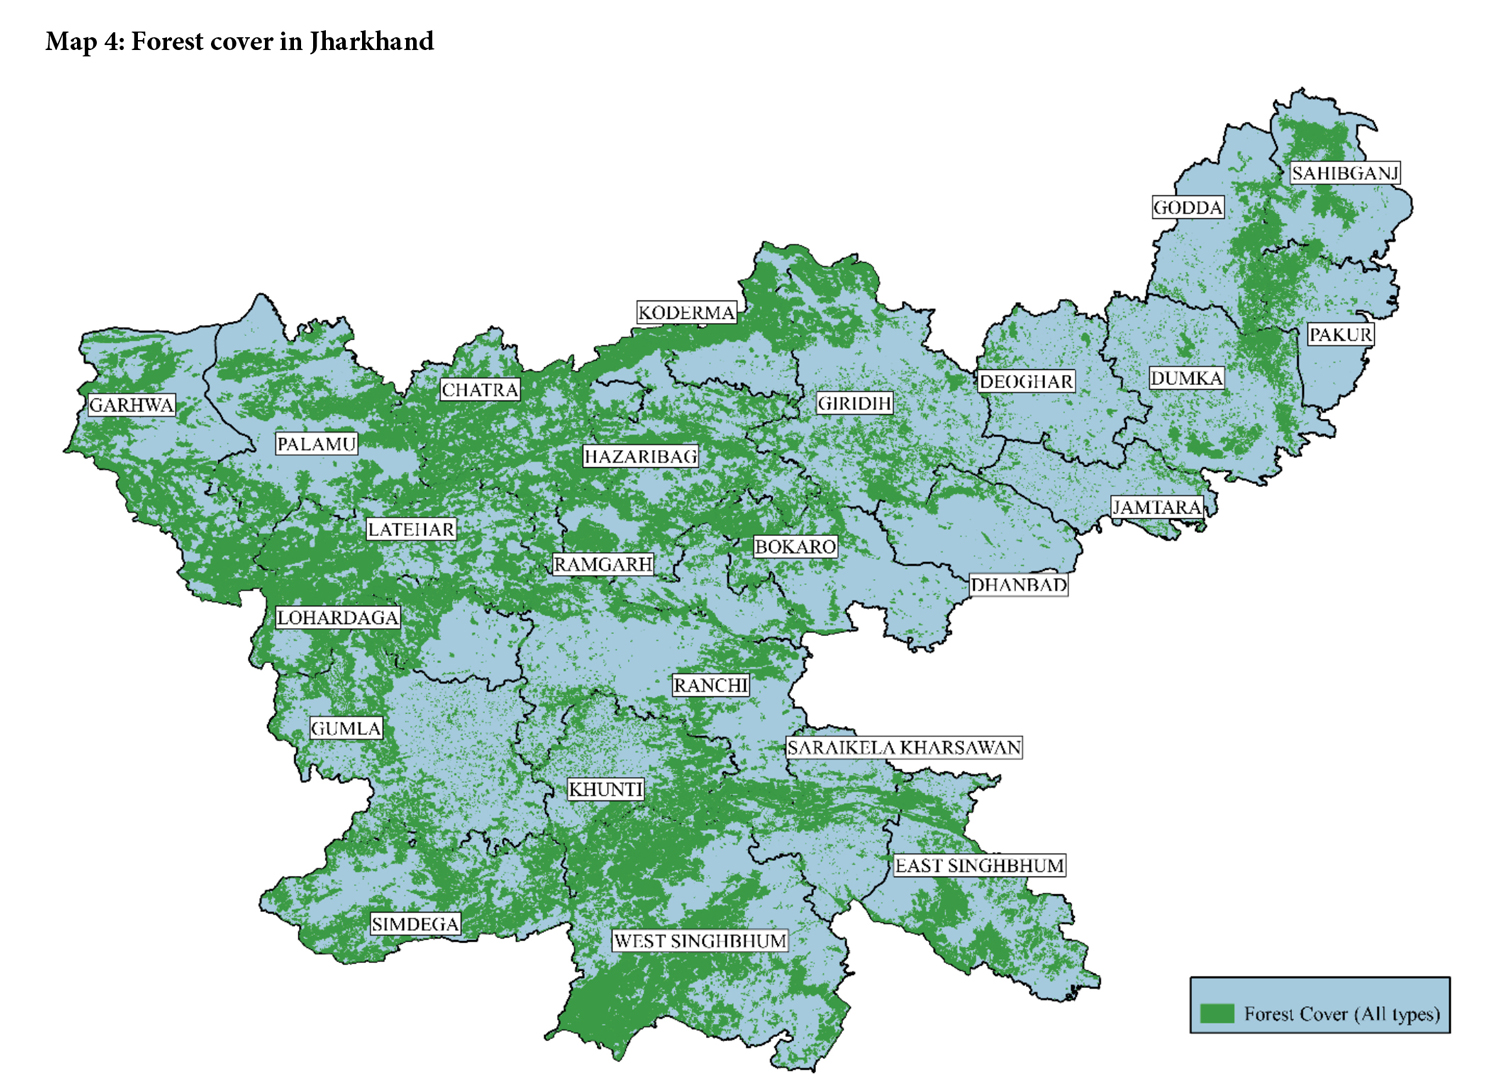
Protecting the forest cover: 29.6 percent of Jharkhand’s total geographic area is covered by forests. Of this, 3.2 percent has very dense forests, 12.2 percent moderately dense forests, and 14.2 percent open forests.[2] The total forestry cover varies across the 24 districts of Jharkhand, from 5.6 percent in Jamtara to 56.1 percent in Latehar. All but four districts experienced an increase in total forestry cover between 2017 and 2019.
Mine closures and wastelands: Mining wastelands make up as much as 0.40 percent of Jharkhand’s geographic area, reflecting poor mining closure practices used in the state. Land restoration needs to be an integral part of mining for it to be sustainable. Dhanbad district has the highest share of mining wasteland (3.93 percent) of its geographic area. The remaining districts have values under 1 percent, with Khunti being the only district with no mining wastelands.
Overview
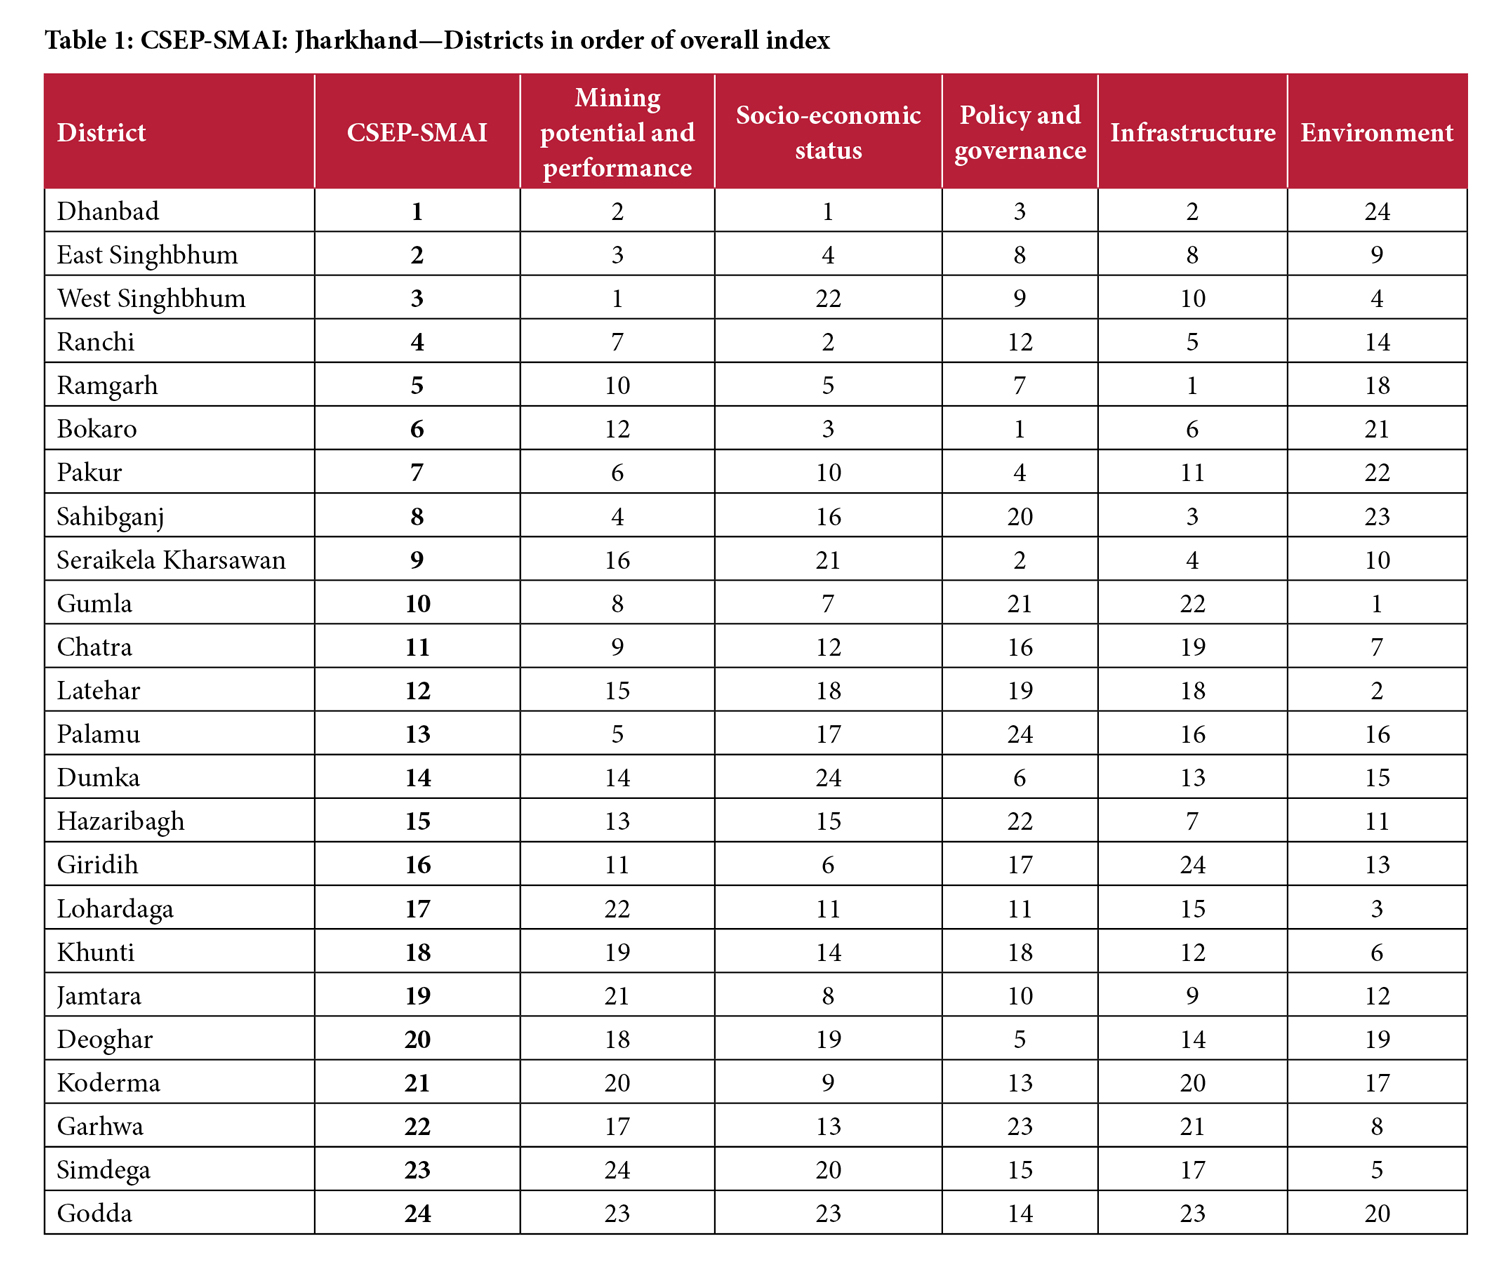
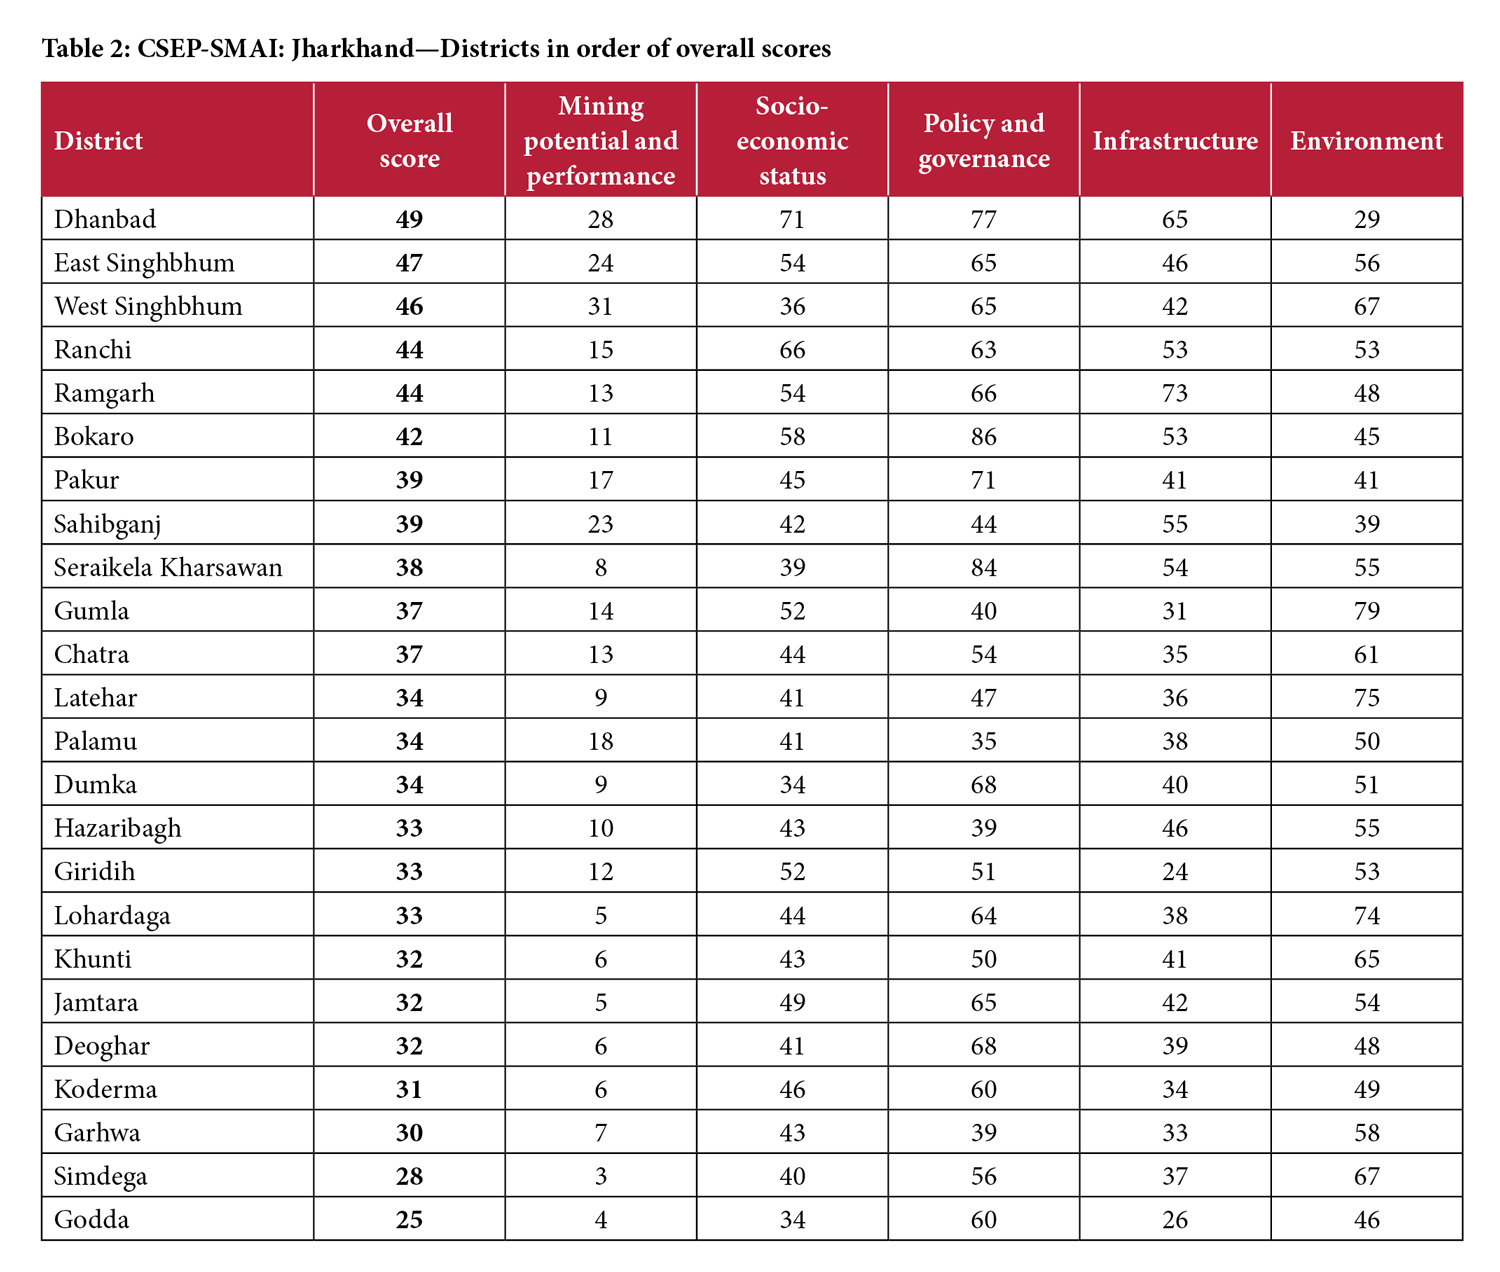
The pillar-wise and overall indices for 24 districts are given in Table 1. The top five districts overall are: Dhanbad (1), East Singhbhum (2), West Singhbhum (3), Ranchi (4) and Ramgarh (5). The five lowest-ranked districts are: Deoghar (20), Koderma (21), Garhwa (22), Simdega (23) and Godda (24). Table 2 provides the scores (pillar-wise and overall) for each district.
Differentials in the pillar-wise indices have important policy implications. Some extremities are apparent. As Table 1 shows, the top-performing district Dhanbad (1), is ranked the lowest on the environment pillar (24). Similarly, East Singhbhum (2) also performs relatively poorly on the environment pillar (9) when compared to its ranks for the other pillars (all in the top 10), while West Singhbhum (3) lies low on the socio-economic status (22) and infrastructure (10) pillars.
On the other hand, two of the lowest-ranked districts—Garhwa (22) and Simdega (23)—rank among the top 10 on the environment pillar. Lohardaga (17), also does well on the environment pillar. Similarly, Jamtara (19), is a relatively better performer on the socio-economic status, policy and governance, and infrastructure pillars.
Sahibganj (8) stands out. It ranks low on three pillars—socio-economic status (16), policy and governance (20), and environment (23)—but ranks high on the mining potential and performance (4) and infrastructure (3) pillars.
A look at the scores for each district—pillar-wise and overall—explains the divergence in ranks. Sahibganj’s good performance on the pillars of infrastructure and mining potential and performance has led it to register a high SMAI score despite its poor performance on the other pillars.
Jamtara (ranked 19 overall) is another interesting case as it gets an above-average ranking on all pillars barring mining potential and performance (21). Jamtara’s scores in the other pillars are not high enough to differentiate it from the remaining districts. Still, its score on the mining potential and performance pillar is much lower than other districts, which brings down its overall rank.
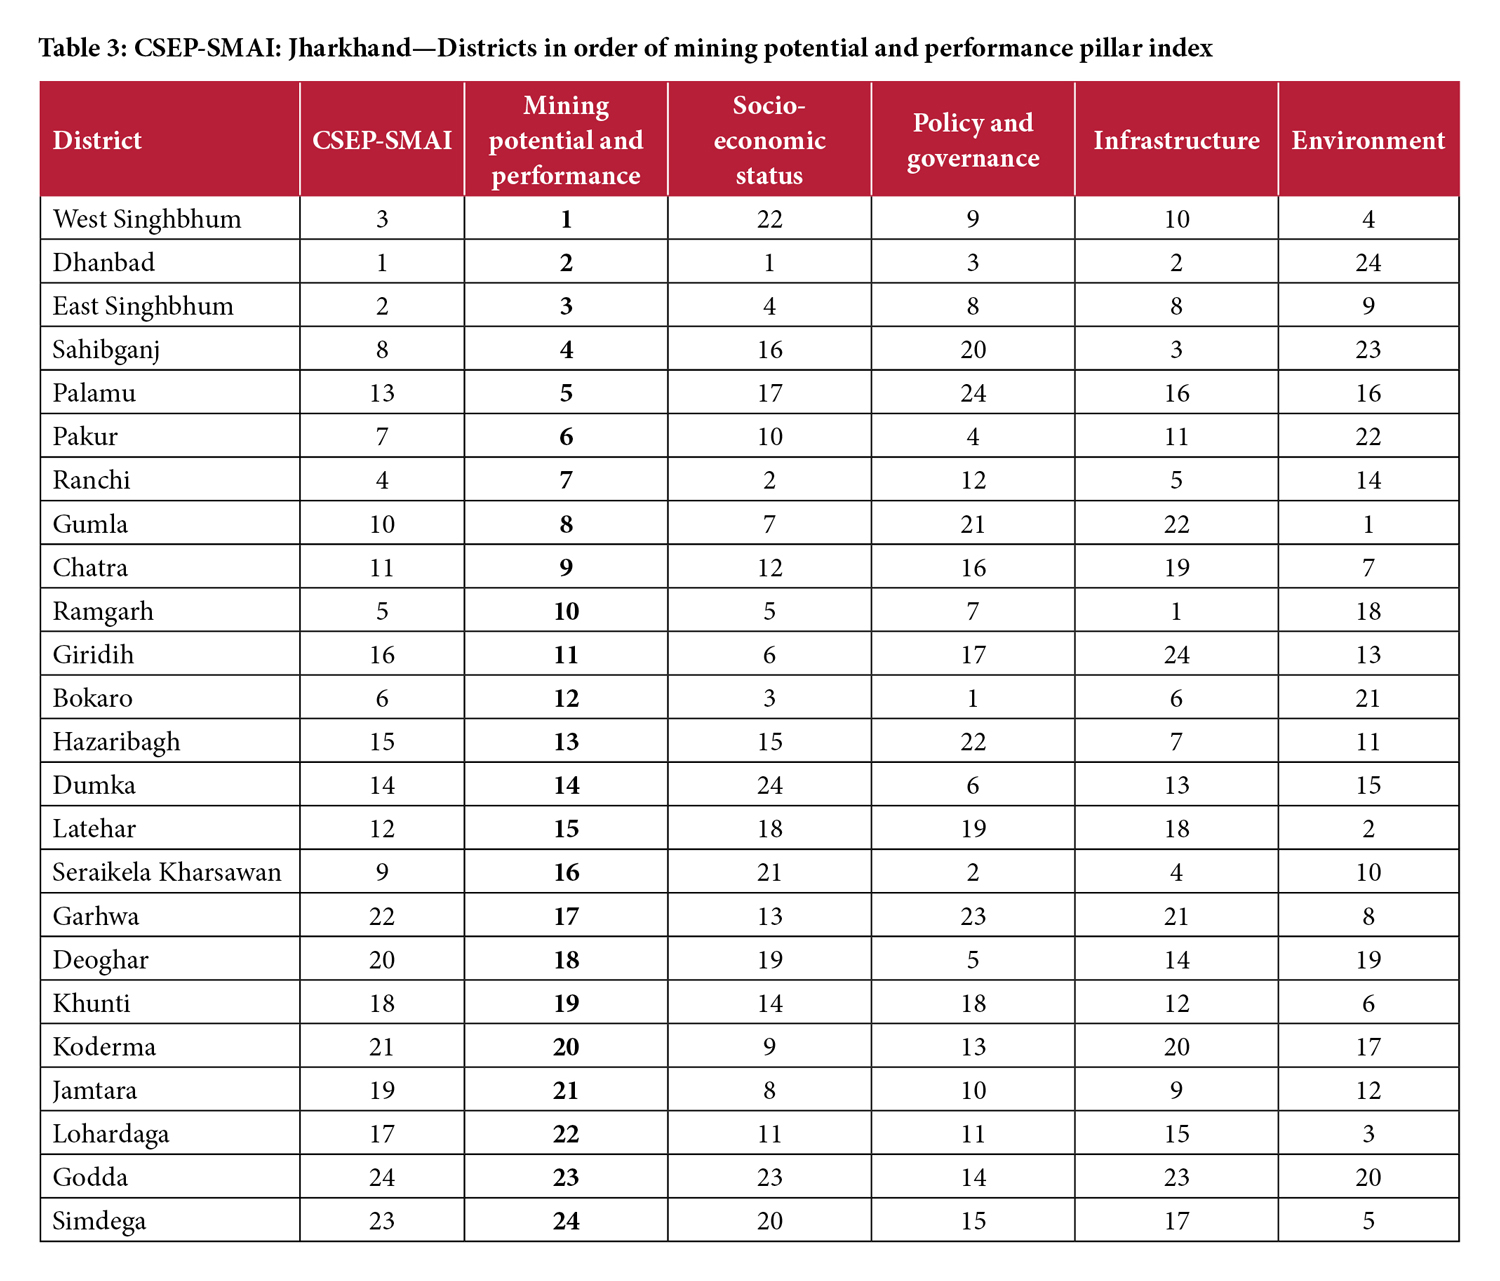
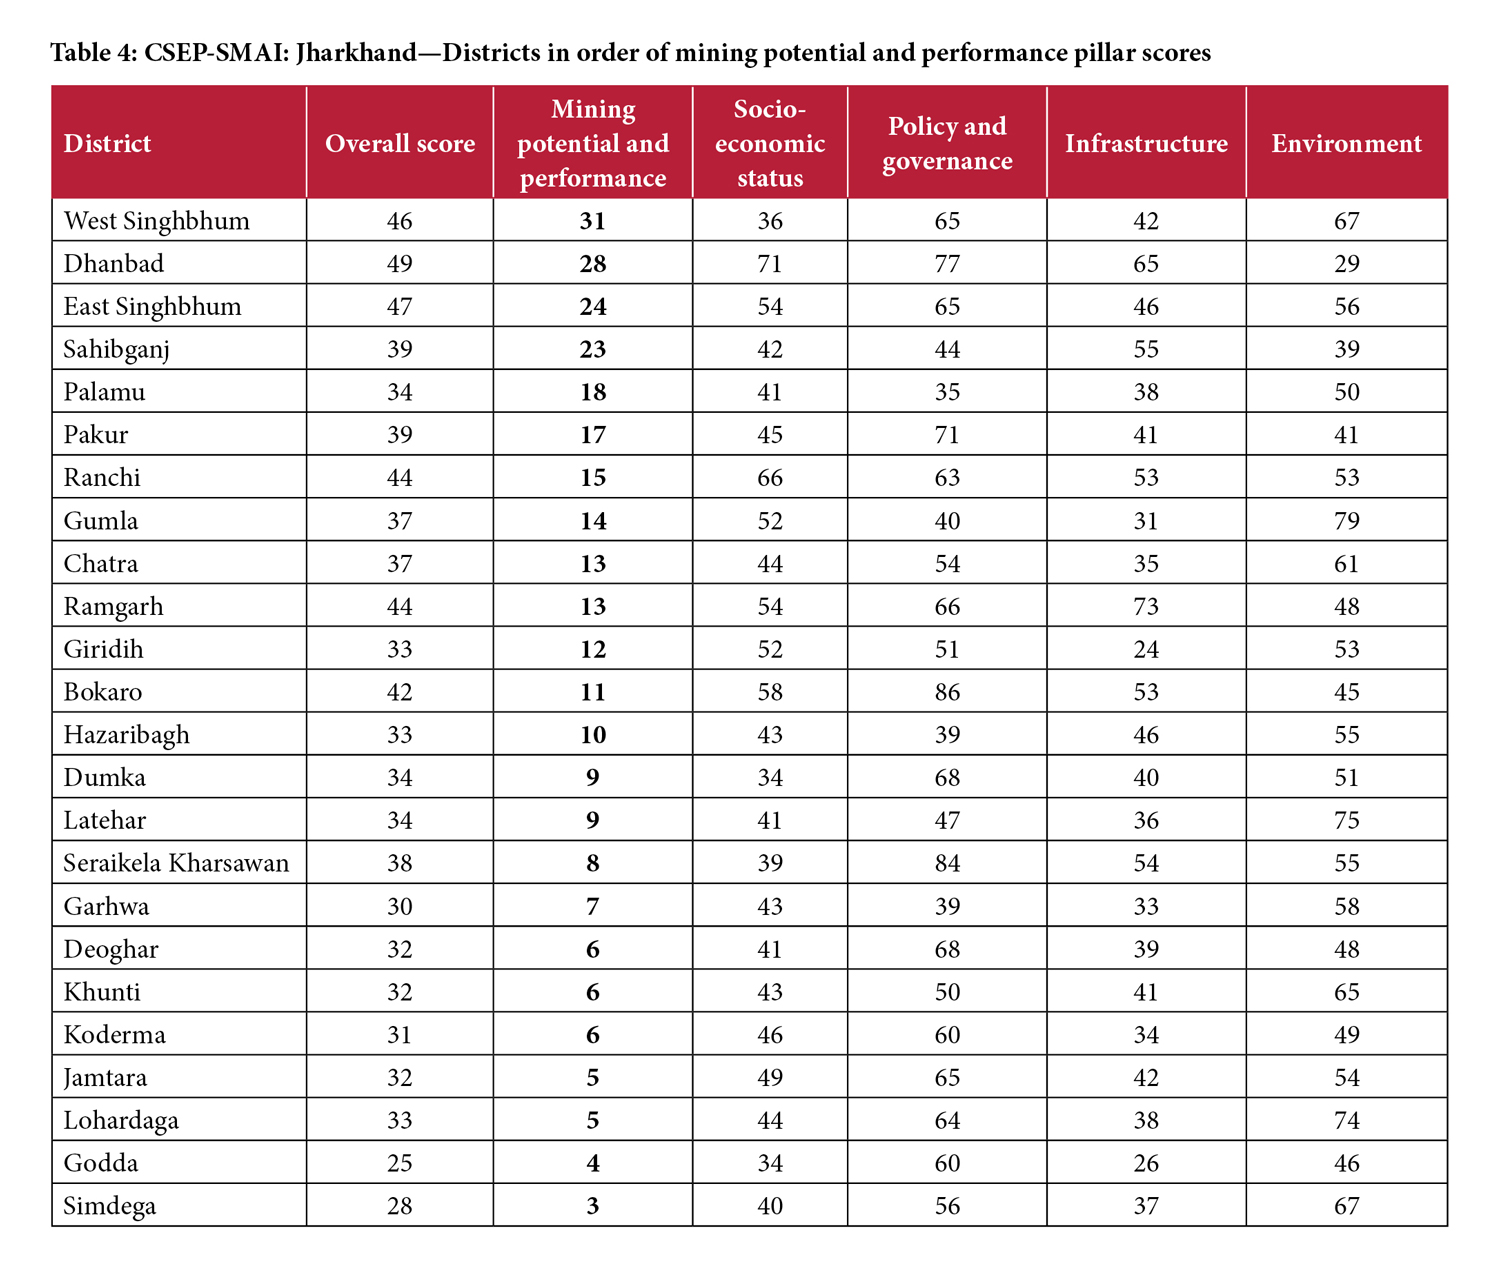
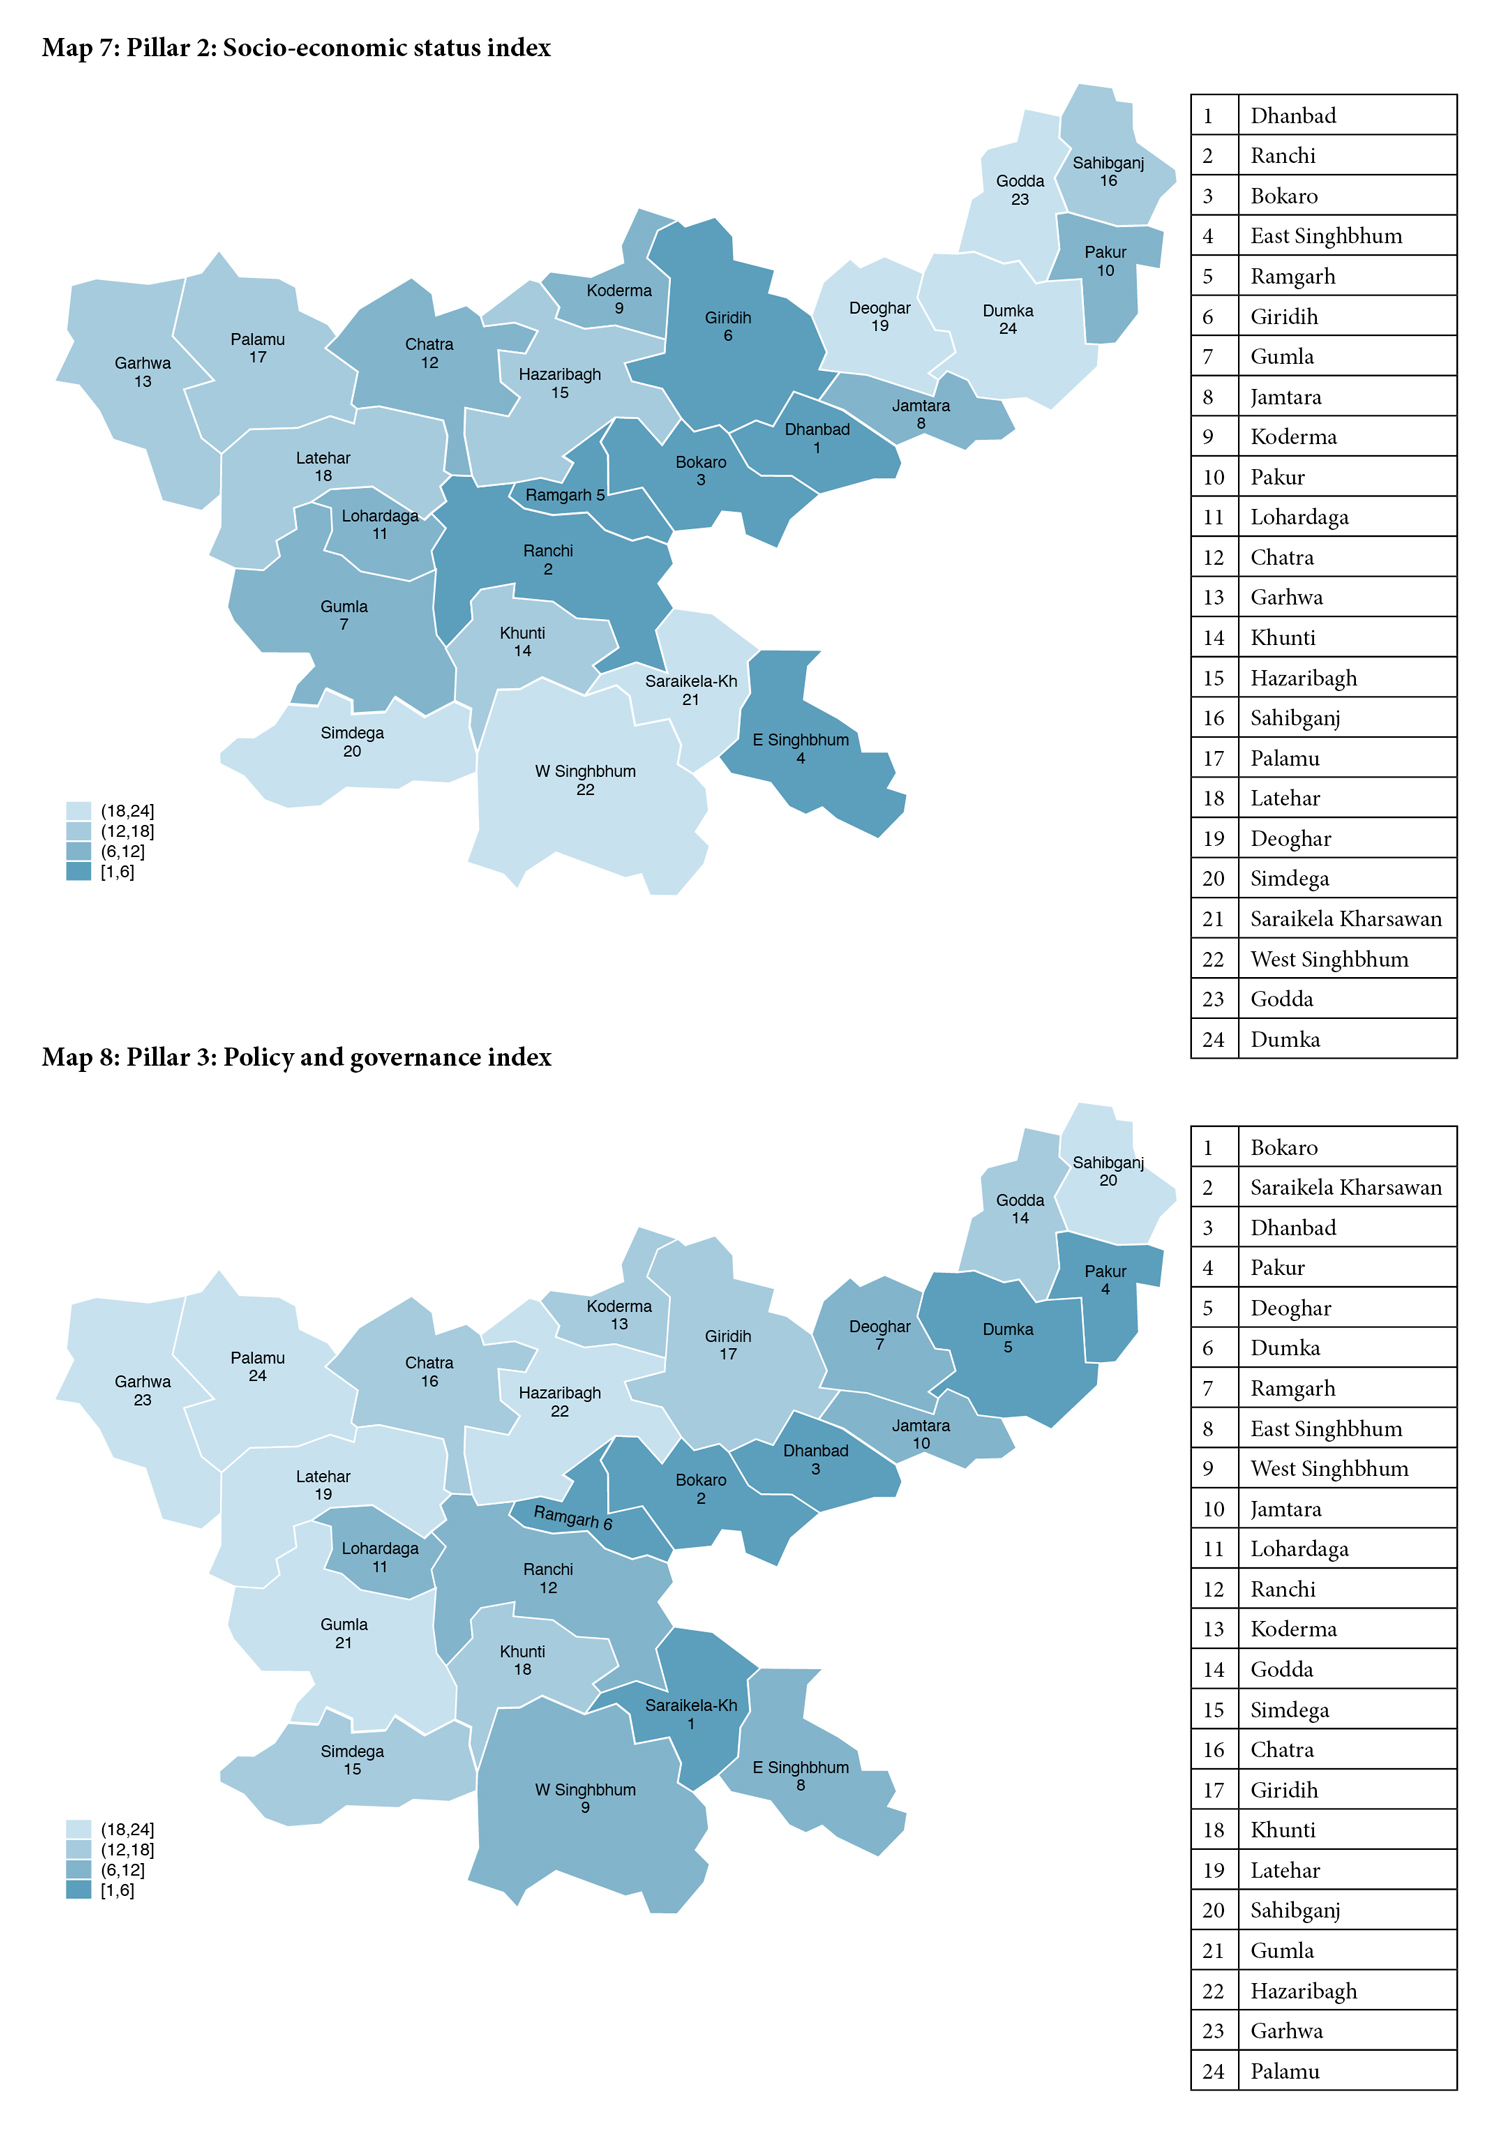
Mining potential and performance index: Top 10 districts
This section examines the top 10 high-performing districts with regard to the mining potential and performance pillar (see Table 3 (by index), and Table 4 (by scores)). This section also discusses some relevant indicators that affect the sustainability of these districts (the detailed breakdown of indicator rankings is provided in Annex C). The sub-indicator scores and ranks provide a deeper understanding of why a district performs poorly on a particular pillar. This would help determine what the district administration should particularly focus on to improve the district’s overall index.
West Singhbhum: Though the top-ranking district in mining potential and performance, its poor rankings on two pillars—socio-economic status (22) and infrastructure (10)—caused the district to slip to third place in the overall ranking.
The district is pulled down by its poor performance on health indicators (infant, maternal, and child health), and in higher secondary-level and graduate-and-above education, which has affected its score on the socio-economic status pillar. Its poor performance on the infrastructure pillar is the outcome of its low road density and poor connectivity to airports.
Dhanbad: The district comes second on the mining potential and performance pillar. Also—though first on the overall index—it ranks last (24) on the environment pillar. The district has the lowest groundwater availability per capita and the highest consumption of groundwater as a share of availability in the state. It also has the highest mining wasteland area as a percentage of its total area.
On the plus side, though it has a comparatively low density of all categories of forests, it is the best performing district in terms of percentage increase of forest cover between 2017 and 2019. Nevertheless, cumulatively, Dhanbad is the worst-performing district in the environment pillar.
East Singhbhum: Ranked high (3) in mining potential and performance, the district’s good performance in all other pillars raises its overall rank to 2. Its relatively poor performance on the environment pillar (9) is due to its low groundwater availability and contaminated rural drinking water sources.
Sahibganj: From ranking 4 on the mining potential and performance pillar, Sahibganj slips to 8 in the overall index. This is due to its poor performance on the pillars of policy and governance (20), environment (23), and its below-average performance on socio-economic status (16).
Sahibganj does poorly on the environment pillar due to the high levels of pollution in the district. It is the worst-performing district on indicators such as groundwater contamination, drinking water contamination (chemical and bacteriological), and PM 2.5 concentrations. Furthermore, it was the worst hit of the three districts in Jharkhand that saw forest cover shrink between 2017 and 2019. Sahibganj’s law and order situation is also amongst the worst in the state, with the highest number of cognisable crimes per lakh population, and the third-lowest number of police stations per lakh population.
Palamu: Though ranked 5 on the mining potential and performance pillar, Palamu drops to 13 in the overall index, because it performs poorly on all other pillars. It takes last place (24) on the policy and governance pillar. Palamu is also among the few districts that are farthest away from their SPCB office. In Palamu’s case, the closest SPCB office to Daltonganj (its district headquarters) is located in Ranchi, 174 km away. Palamu has also suffered multiple incidents of left-wing extremism over the last decade, and has among the lowest number of police stations per lakh population in the state.
Pakur: This district ranks 7 overall and does relatively well on all pillars—policy and governance (4); mining potential and performance (6); infrastructure (11); socio-economic status (10); but on the environment pillar, it ranks 22. This can be attributed to its performance on various environment sub-indicators. It ranks in the bottom 10 in 9 out of 12 sub-indicators, and in the bottom 5 in 5 sub-indicators. It is one of the few districts with polluted groundwater, has high levels of PM2.5 concentrations resulting in high air pollution, and has among the highest percentages of mining wastelands in the state. Nevertheless, Pakur performs well in the consumption of groundwater—it shows only 20 percent consumption of groundwater, with 80 percent available for future usage. It also has no bacterial contamination in its water sources, but 19 percent of its water sources have chemical contamination.
Ranchi: The district that contains the state capital ranks well overall (4) and on three pillars—socio-economic status (2), infrastructure (5), mining potential and performance (7)—but ranks in the middle on policy and governance (12) and environment (14).
Ranchi, however, performs poorly in three out of nine sub-indicators of the policy and governance pillar. It suffered a very high number of left-wing extremism incidents in the period from 2008 to 2015. Ranchi also recorded the second-highest number of cognisable crimes in 2020. Additionally, only 86 percent of the cadastral maps are linked to land records, placing Ranchi among the bottom five districts for this sub-indicator. Ranchi also ranks at the bottom in 4 out of 12 environment pillar sub-indicators—for instance, about 37 percent of its drinking water sources are contaminated with chemical agents, and the district has a relatively lower forest cover compared to other districts.
Gumla: The top-performing district on the environment pillar (1), it also ranks fairly high (7) on the socio-economic status pillar (7), and on the mining potential and performance pillar (8), getting an index of 10 overall. However, it performs very poorly on the policy and governance (21), and infrastructure (22) pillars. With regard to policy and governance, Gumla shows the highest number of left-wing extremism incidents from 2008 to 2020 and performs poorly on all sub-indicators, except two—it has a low cognisable crime rate and 100 percent of its maps are linked to land records.
It also performs poorly in 12 out of the 14 infrastructure sub-indicators. The district has the lowest railway track density, as well as a low number of active mining traders. But it does show a high district road density and is in close proximity to the domestic airport.
Chatra: This district ranks 9 on the mining potential and performance pillar and ranks 11 overall. While Chatra performs well on the environment pillar (7), it does not perform too well on the remaining three pillars. The district also has a low gross district domestic product (GDDP), a high percentage of malnourished children (stunted and underweight), and a high rate of maternal death. It performs well only on one sub-indicator each, in the policy and governance pillar (cadastral maps linked to record of rights), and the infrastructure pillar (number of mining traders active). It has a low railway track density and no industrial plots.
Ramgarh: This district ranks 10 on the mining potential and performance pillar and 5 overall. It performs well on each pillar, except environment (18). It ranks in the bottom 10 on most of the environment sub-indicators except groundwater pollution, bacterial contamination of drinking water and the percentage of mining wastelands in the district. It records consumption of available groundwater at about 70 percent, which is the highest consumption level after Dhanbad (76 percent).
Overall assessment
The indexing of the five pillars (mining potential and performance; socio-economic status; policy and governance; infrastructure; and environment), and the comprehensive Sustainable Mining Attractiveness Index (SMAI) carry not just policy implications for the district administrations and the Government of Jharkhand, but also provide benchmarks for guiding mining investment decisions in the state.
A holistic understanding of mineral resources-led development: The CSEP-SMAI study portrays a holistic overview of 24 districts of Jharkhand with regard to the five pillars. While the mining potential of a district may be an important incentive for mining investments, the miner would also consider the policy and governance, and infrastructure issues. The district government should be equally concerned about both these issues, as well as about the socio-economic status and environmental sustainability of mining.
Slack in exploration: The lack of exploration has been one of the most significant factors in keeping India’s mining sector’s performance behind its peers. While much of the discussion relates to the national-level mining policies, the state government can also play a significant role through its own parameters. For example, two strategic minerals, beryllium and tungsten, are yet to be excavated in Jharkhand (Lele, 2019).The Jharkhand State Mineral Development Corporation Limited (JSMDC), has outlined the state mineral policy as follows:
To facilitate systematic, scientific and planned utilisation of mineral resources and to accelerate the mineral-based development of the State, the Jharkhand Industrial Policy has incorporated relevant policy guidelines. The policy aims to ensure optimal utilisation of available mineral resources, development of vast mineral potential, generate revenues for socio-economic development, impart boost to the economy of the State and enhance the employment opportunities. (Jharkhand State Mineral Development Corporation Ltd., 2020)
Interplay of pillars affects district’s CSEP-SMAI: The overall index of the districts provides an overview of the interrelationships between the pillars, as well as the interplay of the pillar-wise performance on a district’s overall rank. For instance, a district like Palamu ranked 5 on the mining potential and performance pillar but slid down to an overall rank of 14. The findings make it clear that this is because Palamu’s performance on the other four pillars is relatively low, with the policy and governance pillar posting the lowest rank of 24—an alarm bell for the Palamu district administration as well as the Government of Jharkhand.
Guiding mining investments: This paper is a pioneering attempt to present a consolidated ‘mining attractiveness scenario’ across the 24 districts of Jharkhand. It helps potential mining investors gain an insight into the status of the critical five pillars for each district examined in the course of the study. Mining investors may find guidelines to steer their future policies accordingly. Of course, all developments are subjective, depending on the state and national mineral policies.
Emerging issues from the top 10 mining potential and performance districts
The results of the study portray a cumulative evolution of the past. While the analysis is a harbinger of mining prospects, it also highlights the need to minimise slack which might have adversely impacted the growth of sustainable mining.
Some clear policy messages are emerging from the discussion in Section 8. Ten of the top mining potential and performance districts could have done much better on sustainable mining, but for the slack in some of the other four pillars, viz. socio-economic status, policy and governance, infrastructure, and environment (see Annex C).
West Singhbhum ranks 1 with regard to the mining potential and performance pillar. However, it needs to boost up its social sector (health and education), and infrastructure (road density) performance. Dhanbad has the top-most score overall and ranks 2 on mining potential and performance. However, it performs abysmally on the environment front (24). It has to reclaim its vast mining wasteland area as well as increase its forest cover. East Singhbhum, ranked 3 on the mining potential and performance pillar, needs to pay attention to increasing its groundwater availability and lowering contamination levels in its rural drinking water sources.
Sahibganj ranks 4 on the mining potential and performance pillar but needs to improve its performance on other pillars (socio-economic status, policy and governance, and environment), paying particular attention to reducing air and water pollution levels. Palamu, ranking 5 on the mining potential and performance pillar, needs to strengthen its policy and governance since it is heavily affected by left-wing extremism. It is one of the districts that has the lowest number of police stations per lakh of population in the state. Pakur, which ranks 6 on the mining potential and performance pillar, performs poorly on the environment pillar. It needs to take care of its groundwater and air pollution issues.
Ranchi ranks 7 on the mining potential and performance pillar but has slack on the policy and governance and environment pillars. The district needs to enhance its policing, since it is severely affected by left-wing extremism and cognisable offences. It also needs to address the problem of its contaminated drinking water sources. The district of Gumla—8 on the mining potential and performance pillar—lacks on infrastructure and policy and governance, and suffered the highest number of left-wing extremism incidents between 2008 and 2020. Ranked 9 on the mining potential and performance pillar, Chatra district needs to improve almost all indicators of the policy and governance, infrastructure, and socio-economic status pillars, with a focus on health outcomes in children under five.
Ramgarh, ranked 10 on the mining potential and performance pillar, ranks 5 overall, but sits towards the bottom 10 in most of the environment sub-indicators, due to poor groundwater availability and consumption, and the lack of increase in forest cover area between 2017–2019.
All these findings lay out clear directions and benchmarks to be attained, if Jharkhand is to attain its true potential in mineral and mining-led development.
Perception-based pillar: The CSEP-SMAI computed in this study is based on five pillars constructed using secondary data. It would be pertinent to have a sixth pillar based on the way stakeholders perceive the mining sector in Jharkhand. Collection of perception data requires visits to the state and the holding of focus group discussions (FGDs) with the Government of Jharkhand, district administrations, mining companies, civil society, and, most importantly, local communities. The perception-based pillar aims to capture opinions regarding externalities affecting the environment, the well-being of local communities, ease of mining operations, and enforcement of regulations. While such visits were on the study team’s agenda, COVID-19 restrictions precluded collecting primary data for this pillar.
Expanding the study to more states: It is proposed to expand the CSEP-SMAI study to other major mining states in India—starting with Odisha and Rajasthan. Besides indexing the districts within these states, it is further proposed to construct a cross-state, ore-specific sustainable mining attractiveness index. For example, the iron ore-rich districts shall be compared across major ore-bearing states, including Odisha, Jharkhand, and Chhattisgarh.
CSEP-SMAI dashboard: The study team proposes to publish the data collected to an online dashboard, which would allow users to adjust the weights given for the sub-indicators and create alternative indices. Such information would be useful for researchers, governments, local communities, civil society, and mining companies.
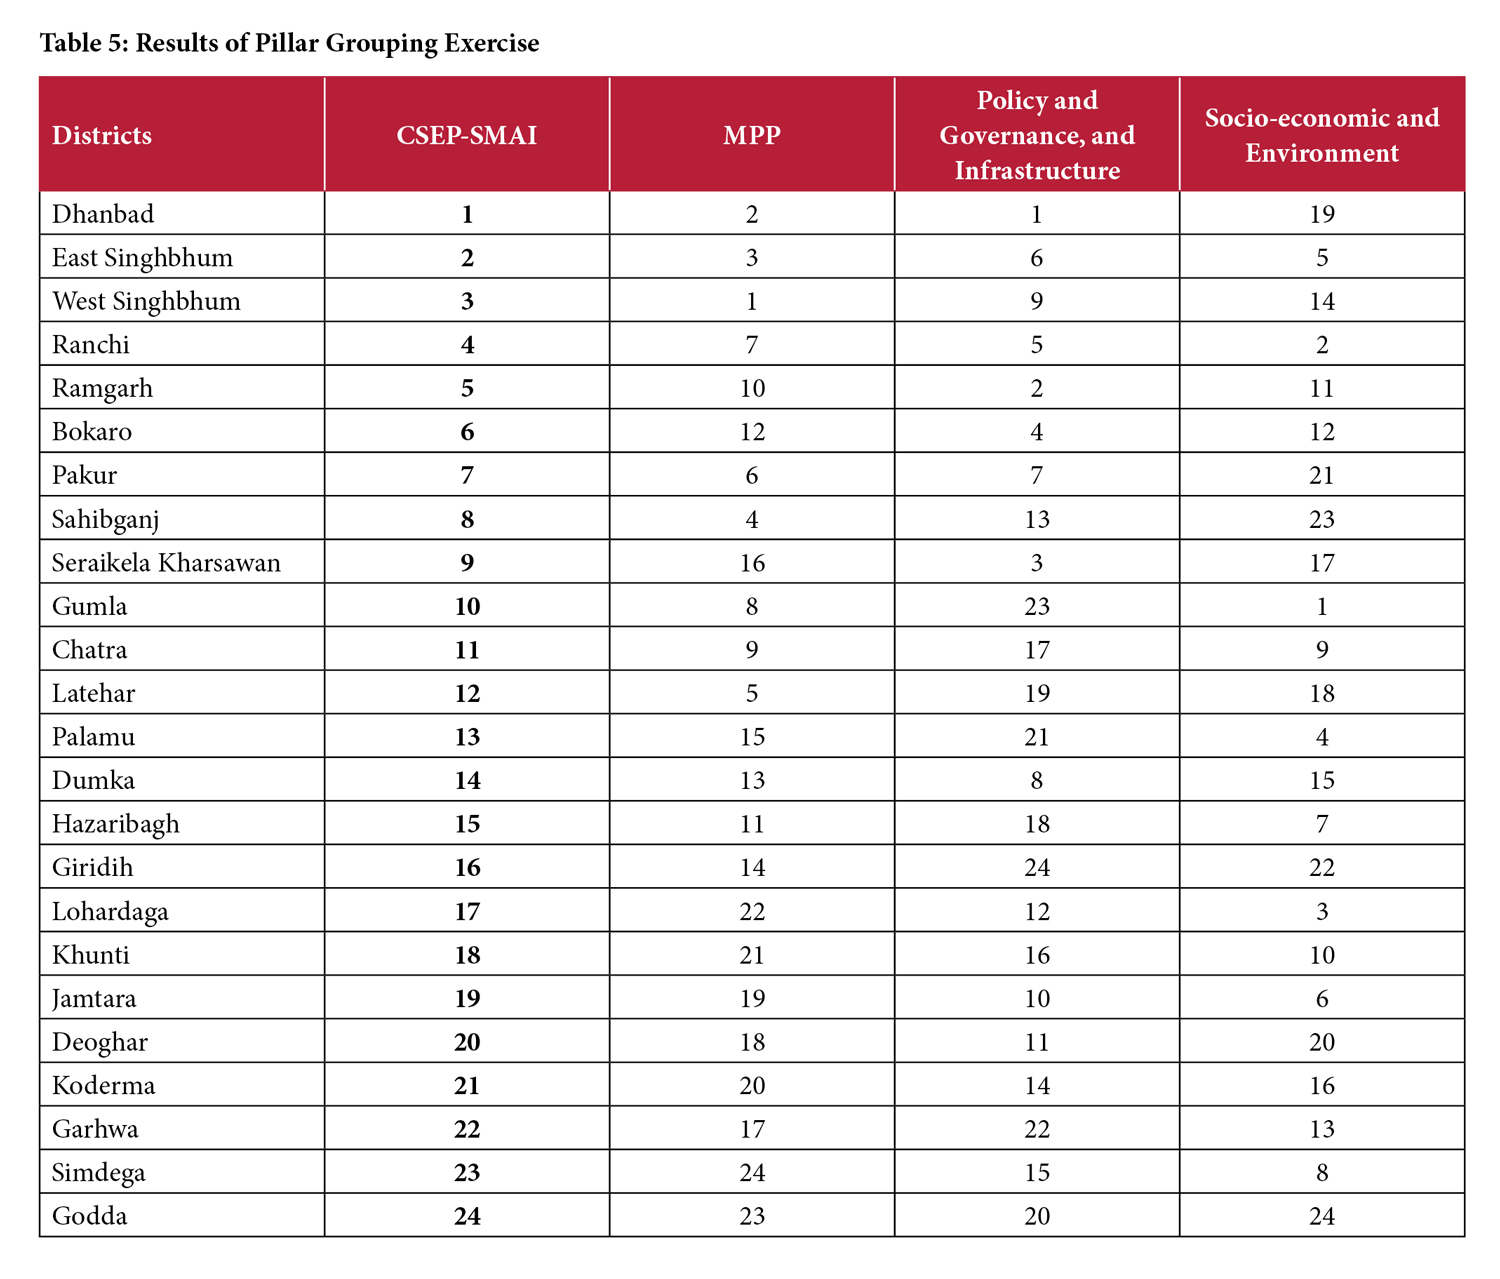
As an example of what can be done through this proposed dashboard, the study team aggregated five pillars into three groups, with equal weights given to the pillars in the second and third groups: 1) Mining Potential and Performance, 2) Policy and Governance, and Infrastructure, and 3) Socio-Economic and Environment. These groupings reflect three broad and different aspects of the districts. For example, the mining companies may be more interested in the first two groups and the district administration the latter two. Table 5 shows the results of this computation. Similarly, other pillar groups can be constructed, with the option of choosing different weights for each pillar.
Coal Controller’s Organisation. (2020). Coal Directory of India 2018-29. Ministry of Coal, Government of India. Retrieved from http://www.coalcontroller.gov.in/writereaddata/files/download/coaldirectory/CoalDirectory2018-19.pdf
Department of Mines & Geology, Government of Jharkhand. (2020, 11 1). Department of Mines & Geology. Retrieved from Department of Mines & Geology: http://jharkhandminerals.gov.in/
Forest Survey of India. (2020, Novemeber 1). Scheme of Classification. Retrieved from https://www.fsi.nic.in/scheme-of-classification
Global Data Lab. (2020). Subnational Human Development Index 4.0. Institute for Management Reserach, Radboud University. Retrieved from https://globaldatalab.org/shdi/2018/indices/IND/?levels=1%2B4&interpolation=0&extrapolation=0&nearest_real=0
Indian Bureau of Mines. (2009). Guidelines Under MCDR for United Nations Framework Classification of Mineral Reserves / Resources. Nagpur: Indian Burea of Mines. Retrieved from http://ibm.nic.in/writereaddata/files/07042014175101unfc.pdf
Indian Bureau of Mines. (2019). Indian Minerals Yearbook 2018 (Part-I): State Reviews. Ministry of Mines, Government of India. Retrieved from https://ibm.gov.in/writereaddata/files/02042020163844Jharkhand_2018.pdf
Jharkhand State Mineral Development Corporation Ltd. (2020, November 1). Jharkhand Mineral Policy. Retrieved from https://www.jsmdc.in/web/JharkhandMineralPolicy.php
Lele, A. (2019). India’s Need for Strategic Minerals. National Security, 2, 247-263. Retrieved from https://www.vifindia.org/sites/default/files/national-security-vol-2-issue-2-article-Alele.pdf
Ministry of Coal, Government of India. (2020). Coal Directory of India 2018-19. Kolkata: Coal Controller’s Organisation. Retrieved from http://www.coalcontroller.gov.in/writereaddata/files/download/coaldirectory/CoalDirectory2018-19.pdf
Ministry of Statistics and Programme Implementation, Government of India. (2020). Household Social Consumption Education in India. New Delhi: MoSPI. Retrieved from http://mospi.nic.in/sites/default/files/publication_reports/Report_585_75th_round_Education_final_1507_0.pdf
National Council of Applied Economic Research. (2018). NCAER State Investment Potential Index 2018. New Delhi: National Council of Applied Economic Research. Retrieved from https://www.ncaer.org/publication_details.php?pID=296
Niti Aayog. (2019). SDG India: Index & Dashboard 2019-20. Governemnt of India. Retrieved from https://niti.gov.in/sites/default/files/SDG-India-Index-2.0_27-Dec.pdf
Planning-cum-Finance Department. (2020). Economic Survey of Jharkhand 2019-20. Ranchi: Centre for Fiscal Studies, Government of Jharkhand. Retrieved from https://openbudgetsindia.org/dataset/jharkhand-economic-survey-2019-20-2020-21/resource/f1f9ec50-6388-4f0b-84a2-df54c49fbe20
Press Information Bureau. (2019). Electrification of Villages. Ministry of Power, Government of India. Retrieved from https://pib.gov.in/Pressreleaseshare.aspx?PRID=1592833
Stedman, A., Yunis, J., & Aliakbari, E. (2020). Annual Survey of Mining Companies 2019. Fraser Institute. Retrieved from https://www.fraserinstitute.org/studies/annual-survey-of-mining-companies-2019
FOOTNOTES
[1] Minerals are classified under the ‘major’ and ‘minor’ categories by the Government of India’s Mines and Minerals (Development and Regulation) Act, 1957.
[2] The Forest Survey of India (Ministry of Environment, Forest and Climate Change) classifies these as follows. Very dense forest: All lands with tree cover (including mangrove cover) of canopy density of 70 percent and above. Moderately dense forest: All lands with tree cover (Including mangrove cover) of canopy density between 40 to 70 percent. Open forest: All lands with tree cover (Including mangrove cover) of canopy density between 10 to 40 percent. (Forest Survey of India, 2020)


Find on this page
The Centre for Social and Economic Progress (CSEP) is an independent, public policy think tank with a mandate to conduct research and analysis on critical issues facing India and the world and help shape policies that advance sustainable growth and development.