
India’s Housing Vacancy Paradox: How rent control and weak contract enforcement produce unoccupied units and a housing shortage at the same time
Reading Time: 35 minutesEditor's Note
This is an update to the CSEP Working Paper, "India’s housing vacancy paradox: How rent control and weak contract enforcement produce unoccupied units and a housing shortage at the same time", which was originally published on January 18, 2021.
Abstract
DOWNLOADS
One housing paradox in many markets is the simultaneous presence of high costs and high vacancy. India has expensive housing relative to incomes and an urban housing vacancy rate of 12.4%. We look at two possible explanations for vacancy – pro-tenant rent control laws and poor contract enforcement. We use public goods as a placebo test. Using a two-way linear fixed effects panel regression, we exploit changes in rent control laws in the states of West Bengal, Karnataka, Gujarat, and Maharashtra to find that pro-tenant laws are positively related to vacancy rates. A pro-landlord policy change liberalising rent adjustments reduces vacancy by 2.8 to 3.1 percentage points. Contract enforcement measured by density of judges is negatively related to vacancy. Provision of public goods and amenities tend to raise vacancy. This is consistent with property owners tending to be reluctant to rent out their properties in more desirable areas. We estimate that a policy change in rent control laws would have a net welfare benefit and could reduce India’s housing shortage by 7.5%.
JEL Classification: P48, R31, R38
Keywords: Vacant Housing, Rental Markets, India
With cities around the world facing severe housing shortages, the issue of vacant housing – the apparent opposite of a shortage – has gained prominence, having been covered extensively by the media.[1] Cities such as Washington D.C. and Vancouver have started taxing vacant houses in order to encourage owners to bring the units back into the market. Academic literature on reasons for vacant housing has looked at the impact of government housing finance (Monkkonen, 2019; Reyes, 2020), inequality (Zhang et al., 2016), restrictive regulations (Cheshire et al., 2018), and investments in housing for speculative purposes (Struyk, 1988). The phenomenon of a large number of vacant houses in India has also been in the news.[2] Vacancy is one of a number of serious problems in the Indian housing market – including a housing shortage that is in the millions[3] and a vast number of households living in slums.
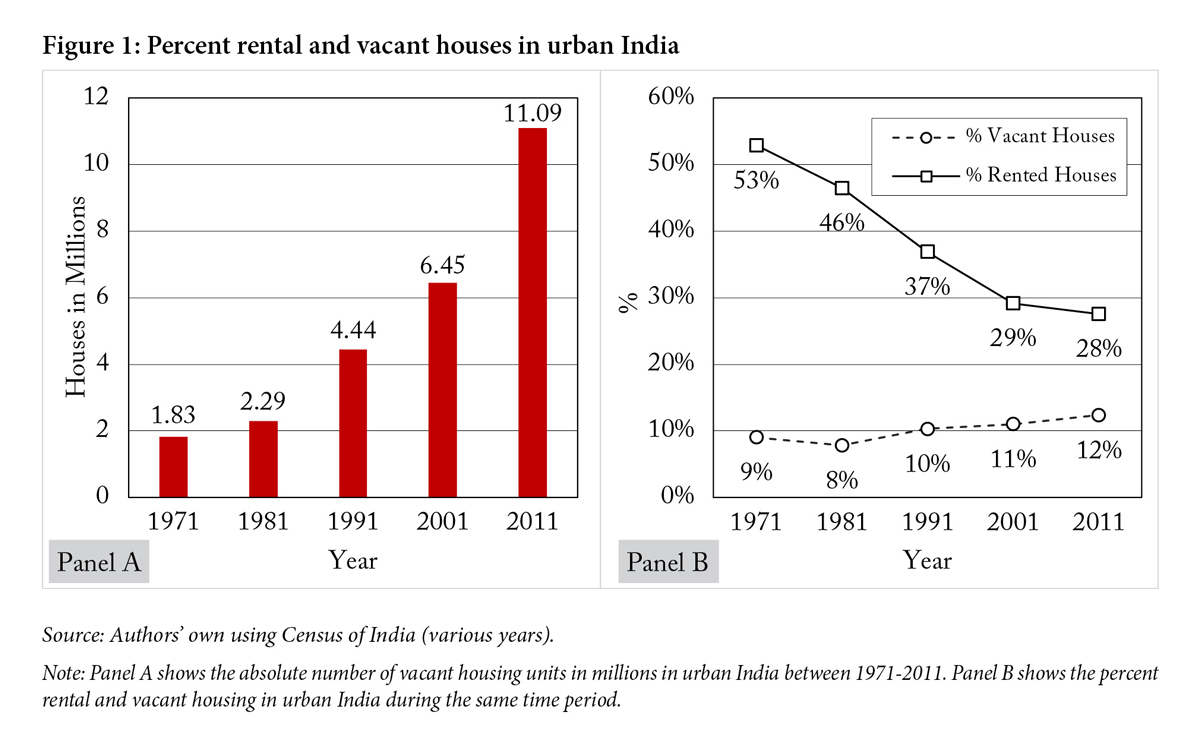
India is the second largest country by population in the world, and as such, makes a compelling case for the study of vacancy in a country with high housing costs[4] The Census of India (2011) reports that 11.1 million units, approximately 12.4% of the total urban housing stock, are vacant. By contrast, the Indian Census reported 1.8 million vacant houses or a vacancy rate of around 9% in 1971 (see Fig. 1). Simultaneously, the rental sector’s share of the occupied residential stock declined significantly (Tandel et al., 2016). This is attributed to the strict rent control laws in India that make it difficult to revise rents and evict tenants (see Glaeser, 2021). In this paper, we argue that a series of laws in India—laws which are also found in other countries—have led some property owners to prefer keeping units vacant over renting them out. These laws thus lead to the simultaneous reduction in housing units available for rent and an increase in vacancy of housing units. We show that the repeal of such laws could lead to more rental units and lower vacancy. We also discuss policies and experiences from other countries to tackle the problem of vacant housing.
We also argue that weak contract enforcement, a feature of many developing countries, adversely affects housing markets.[5] As such, India provides an object lesson for other countries.
The Economic Survey of India of 2017-18 (Ministry of Finance, Government of India, 2018) was the first time that policymakers highlighted some of the issues related to vacant housing.[6] The high share of vacant housing is a symptom of larger inefficiencies in the market and, at the same time, an opportunity to increase housing supply. Given that India will see the largest increase in urban population by 2050 (United Nations, 2018), studying vacant housing and creating policies to address this issue requires urgent attention. There has been scarce academic research on vacant housing in India. This paper aims to fill this lacuna.
The paper focuses on intentional vacancies in India, i.e., a strategic decision by landlords to keep housing vacant. It explores two potential reasons for this, pro-tenant rent control laws and weak contract enforcement. We also run a test where we use provision of public goods as a placebo.
The negative impact of hard rent control on housing markets is well documented in literature (Arnott 1988, 1995). But there are very few papers (Gabriel & Nothaft, 2001; Segú, 2020), to our knowledge, documenting its possible impact on housing vacancy. We exploit changes in the rent control laws in the states of West Bengal, Karnataka, Gujarat, and Maharashtra for our study. We define the treated group as the districts in the states where the rent control laws changed and the control group as districts where there were no changes. We use a two-way linear fixed effects panel regression design to establish a relationship between pro-tenant rent control laws and vacancy rates in districts between 2001 and 2011. Our results show that a pro-landlord policy move that allows rent revisions reduces housing vacancy by 2.8 to 3.1 percentage points and leads to a net welfare gain. Such a move, we estimate, would also reduce India’s housing shortage.
Developing countries often have overstretched judiciary systems which are unable to expeditiously resolve contract disputes, including tenant-landlord disputes. We hypothesise that slow-moving judicial systems discourage property owners from renting to tenants; so far as we know, we are the first to test this hypothesis. As a robustness check, we test for how vacancy reacts to various placebos – set of public goods and amenities, including schools, colleges, hospitals, dispensaries, and roads – at the district level using panel data for two census years, 2001 and 2011. Provision of public goods and amenities as measured by educational institutions, medical institutions, and roads tend to raise vacancy. This is consistent with property owners tending to be reluctant to rent out their properties in more desirable areas.
In the next section, we provide a broad overview of the housing market in India, with a focus on rental and vacant housing. We also summarise relevant literature on the subject. We describe our empirical strategy and data and present evidence of distortions in housing markets and share our results. To test the robustness of our findings, we explore the impact of lack of public goods and amenities on vacant housing. The paper also looks at the welfare implications of rent control policy changes and provides policy recommendations.
Formal housing, slums, and tenure choice
Formal housing supply has not kept pace with the growing demand in Indian cities. This is due to reasons like stringent land use regulations (Brueckner & Sridhar, 2012; Sridhar, 2010),[7] delays in housing construction (Gandhi et al., 2021), and limits on ownership of private land (Siddiqi, 2013). The unresponsiveness of the formal market has led to 17.4% of the urban households living in slums in India (Bertaud, 2010).
Renting as a percentage of total units in urban India has declined from 53% in 1971 to 28% in 2011 (see Panel B in Figure 1). According to the Census of India, 26.3% and 27.8% of households live in rental accommodation in slums and formal housing, respectively (see Table 1).[8]
The low share of renting in slums goes against the popular belief that renting is the dominant tenure choice, given the flux of labour and absence of formal regulations. A survey of slums in Pune found that 15% of households were renting (Nakamura, 2016). While comparing slums across different cities in the world, Marx et al. (2013) found that 26% of the slum households in Mumbai are in rental accommodation.
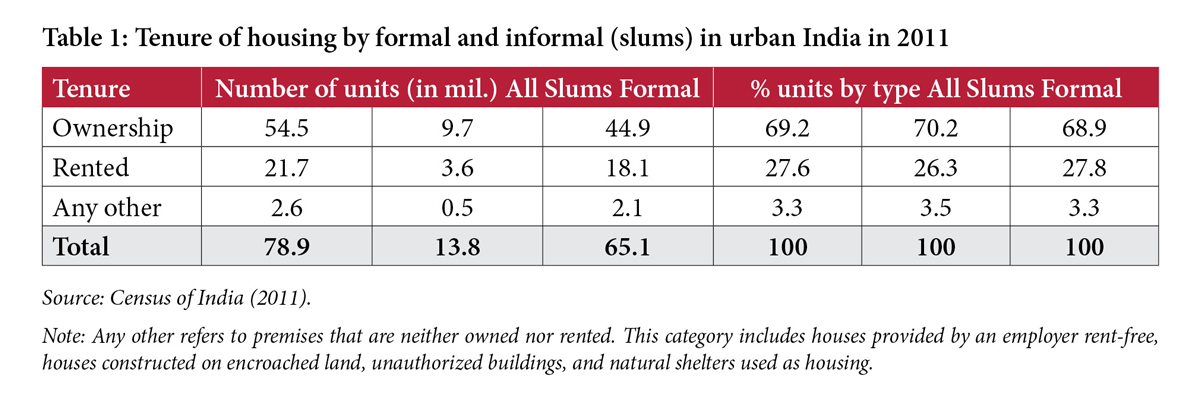
Table 2 shows the tenure status by household income distribution in urban India. Using monthly per capita expenditure (MPCE) as a proxy for income, we see that renting exists in all income categories. While the share of renting is the highest for households in the last quintile, renting is also an important choice for middle-income households.
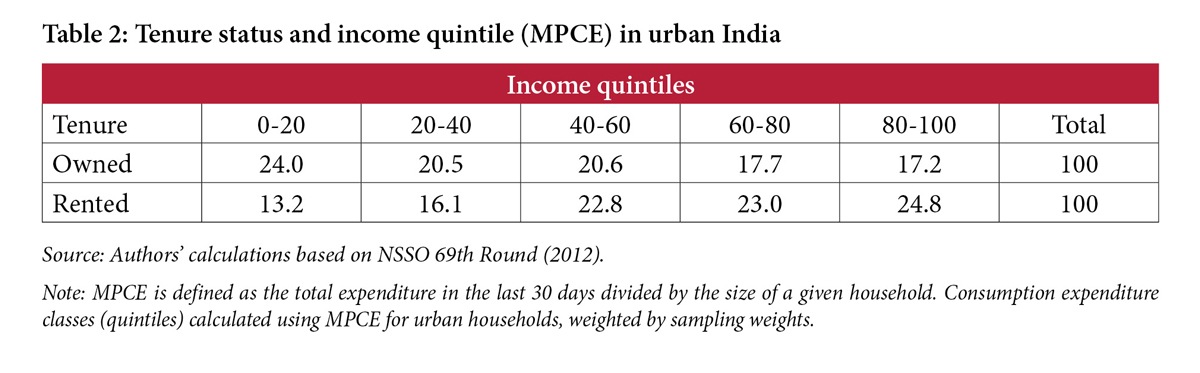
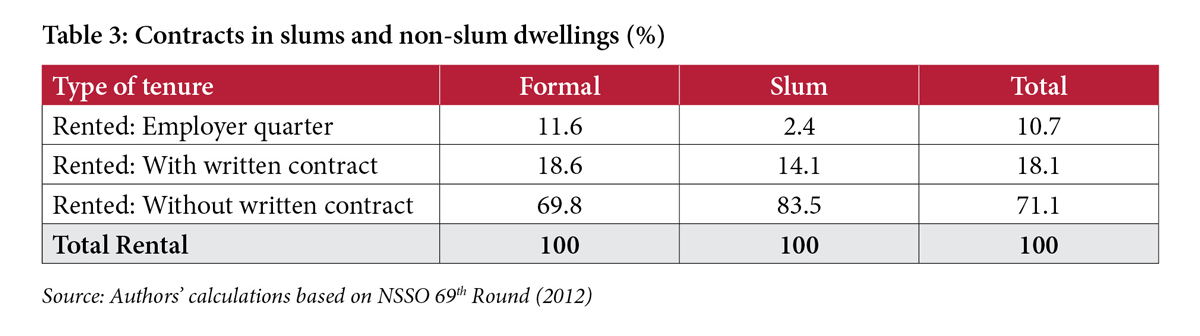
Table 3 shows the different contract arrangements for rental housing. Only 14.1% of the slum households have written rental contracts.[9] Further, only 18.6% of households in formal rental housing have written contracts. The low share of written contracts in slums is expected given their informal nature, whereas the rather low share in formal housing could be because landlords want to evade rent control laws or save on time and monetary costs associated with formal contracts (Sharma, 2017).
History of rent control in India
During the First World War, food price inflation in India (particularly in the city of Bombay) led landlords to increase rents steeply, causing a rise in evictions.[10], [11] In order to curb rising rents and evictions, the rent control law was introduced for the first time in Bombay in 1918, followed by in Calcutta in 1920 (Tembe, 1976). Other states introduced rent control after the Second World War (Jauhar, 1995). While these acts protect tenants, they also permit landlords to evict tenants and increase rents under certain conditions.
For instance, nearly all rent control laws allow landlords to evict tenants if rent is not paid for a period of time that is stipulated in the law. This varies across states, ranging between 0.5 months to 7 months.
We found cases of such evictions in many states, with two cases of particular interest – Madan Mohan and Anr. v. Krishan Kumar Sood (1993)[12] from Himachal Pradesh[13] and E. Palanisamy v. Palanisamy (Dead) (2003)[14] from Tamil Nadu.[15] In these cases the Supreme Court ordered the eviction of tenants for non-payment of rent. Further, the Supreme Court noted that while the rent control acts are made to protect tenants, it is the responsibility of the tenant to pay rent in the stipulated time to remain under these acts’ protection. Hence, these cases demonstrate that eviction clauses have teeth. That said, these cases did take nine to 10 years to adjudicate.
Rent control acts also place restrictions on when and how rent can be increased.[16] There is variance across states in India and some states are relatively pro-landlord in allowing rent revisions. Tenants have challenged increases in rent as stipulated under pro-landlord laws. However, the landlords’ rights under the rent control act are protected. For example, in the Ujwalabai alias Meena Shantaram Apte v. Namdeo Dnyanoba Shingare (2001)[17] case, the landlord increased rents as per the law and the tenant refused to pay the increased rent and challenged the increase. The High Court found the increase in rent acceptable and evicted the tenant on the grounds of non-payment of rent.
Landlords have adapted to the rent control laws and have found ways to work around them. Table 3 shows that a considerable share of rental contracts in formal housing are unwritten. There is a growing preference among landlords for short-term (typically 11 month) license arrangements with tenants (Tandel et al., 2016). Landlords are reluctant to formally register these contracts for fear that the government may, at the stroke of a pen, be able to bring these leases under the rent control law, as it has done in the past.[18] However, the legacy of the rent control law still has a bearing on housing outcomes as it has affected several properties. For example, in 2010, the city of Mumbai had 17% of all formal units under rent control, with several pockets of the island city having more than 50% (Tandel et al., 2016). Recognising the adverse impact of the strict rent control laws on housing markets in India, the government of India has introduced a Model Tenancy Act in 2021 for states to adopt. One of the main objectives of this act is to reduce vacancy across cities. The background note for the Model Tenancy Act starts with, “As per Census 2011 around 110 lakh houses were lying vacant in urban areas. One of the main reasons for non-availability of these houses for rental purpose is the existing rental laws of the States/UTs, which discourage renting.”[19] To achieve this, the act strongly suggests that states liberalise the rents landlords can set when drafting an agreement. It further proposes an alternate judicial setup at the district level for all rental litigation, which is mandated to provide a decision within 60 days.
Vacant Housing in India
The annual growth rate of vacant houses between 1971 and 2011 was 12.7%–75%, faster than the growth of urban households in the same period. Given that the average urban household size in India is 4.66 people, the vacant stock could house almost 50 million people or around 13% of the urban Indian population.
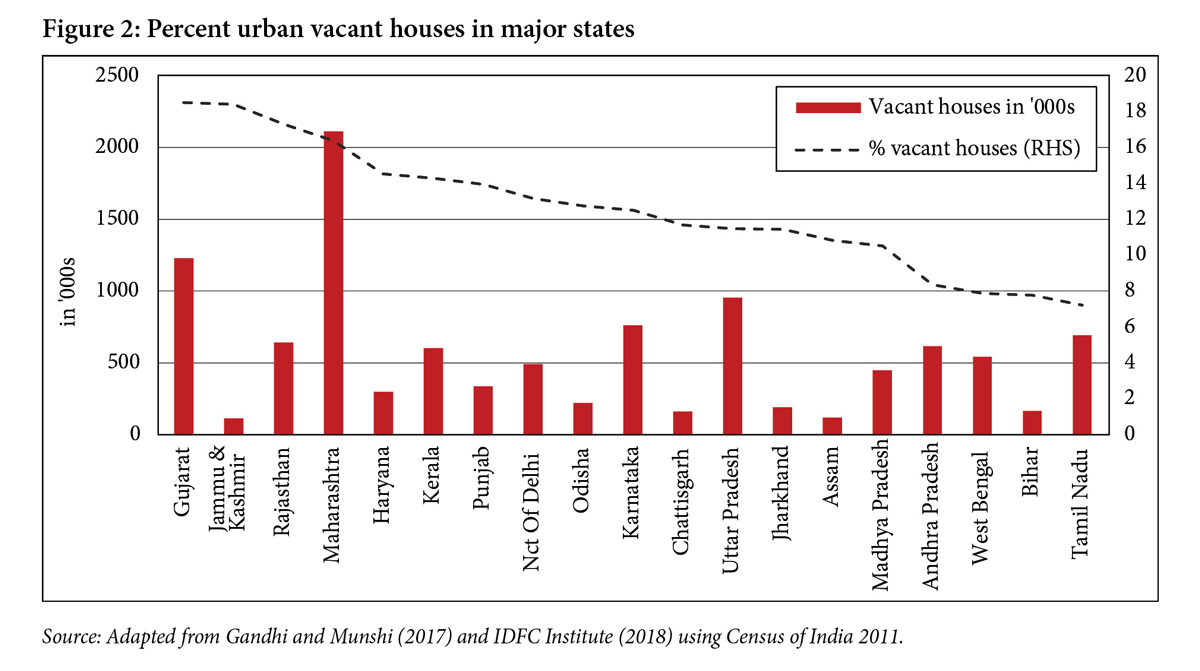
Figure 2 shows the share and number of vacant urban houses for 19 major states and union territories in India. They constitute approximately 96.5% of the total of 11.1 million vacant houses in urban India. Among the larger states, Gujarat has the highest share of vacant houses of the total residential stock (around 19%), followed by Jammu and Kashmir, Rajasthan, and Maharashtra.[20]
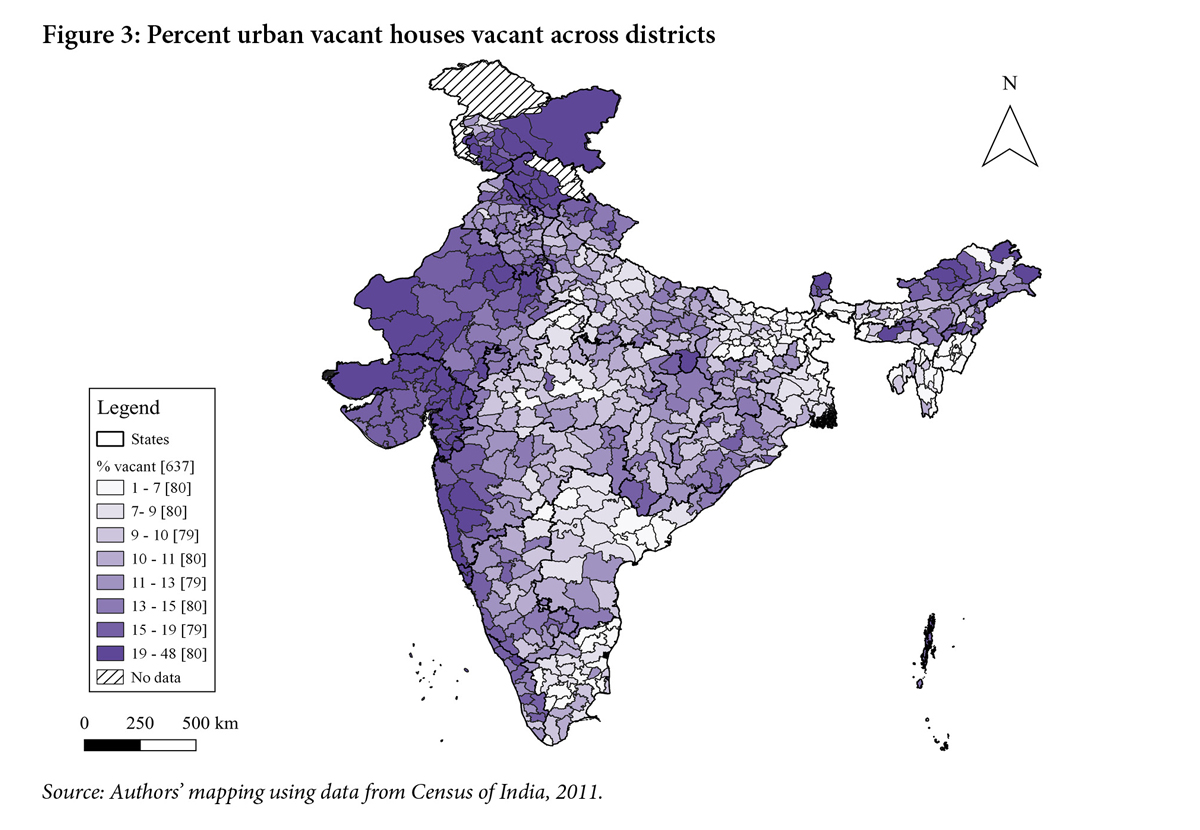
The distribution of vacancy rates at the district level shows the median is around 12%. The distribution is right-skewed, with 77 districts having more than 20% of their residential stock vacant. Almost all of western India has higher residential vacancy rates as compared to the average of 12.38%, as can be noted from Figure 3.
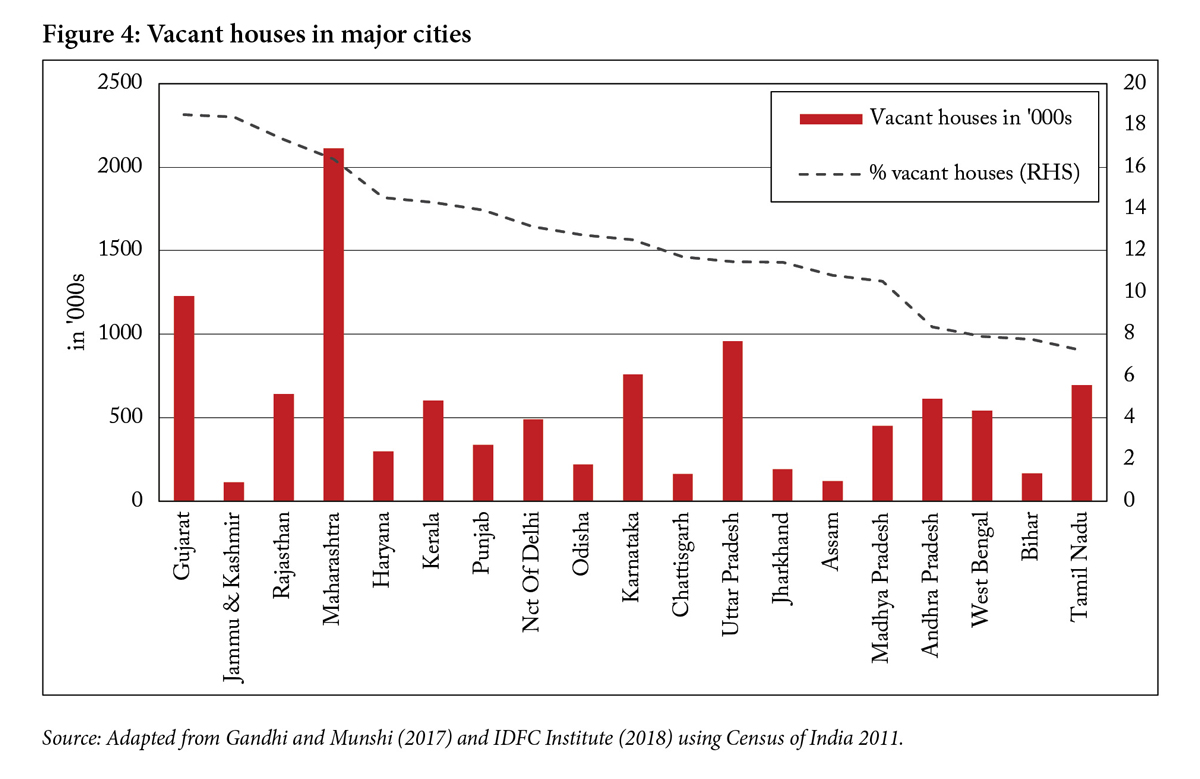
Figure 4 shows the vacant housing situation in Indian cities, each having more than 30,000 vacant houses. Towns on the outskirts of major cities have the highest proportion of their residential stock vacant.
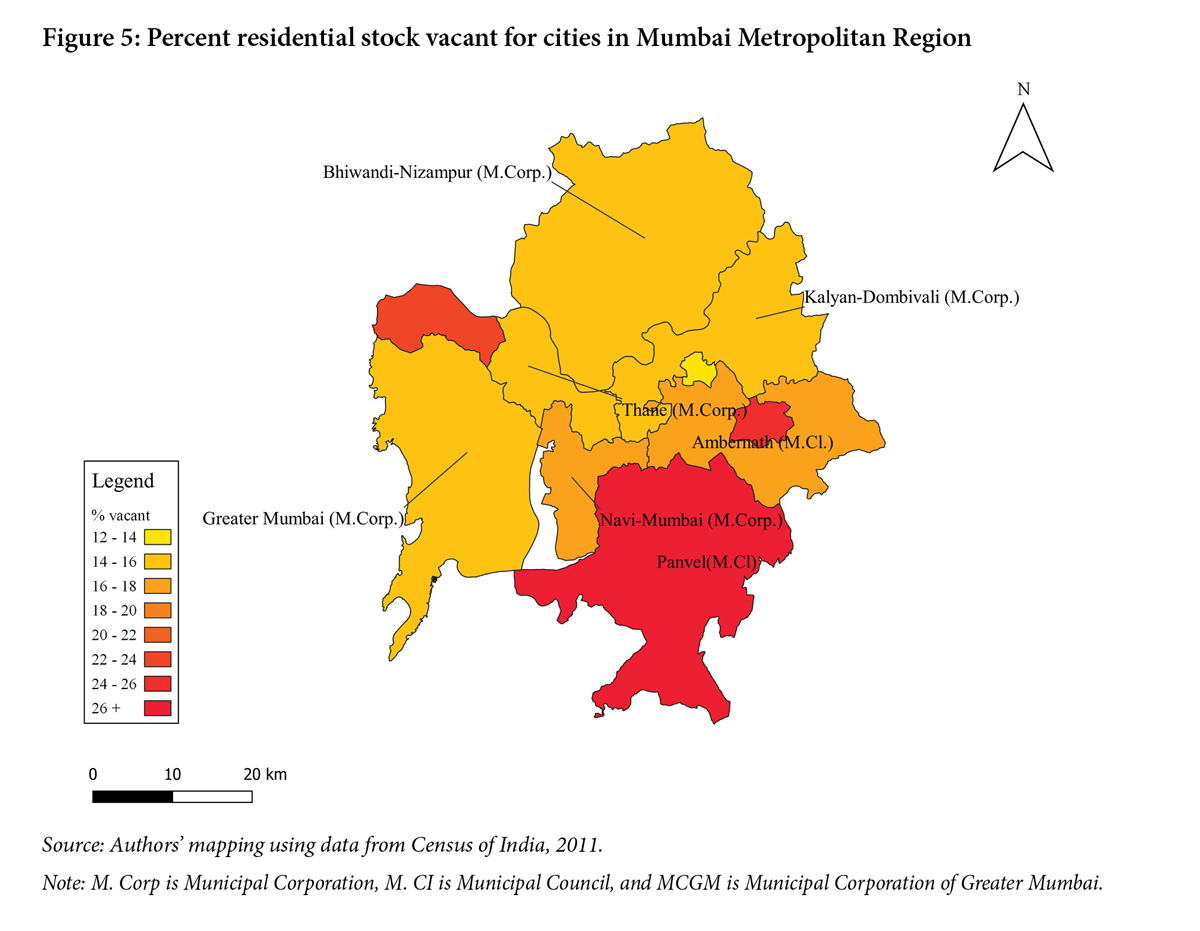
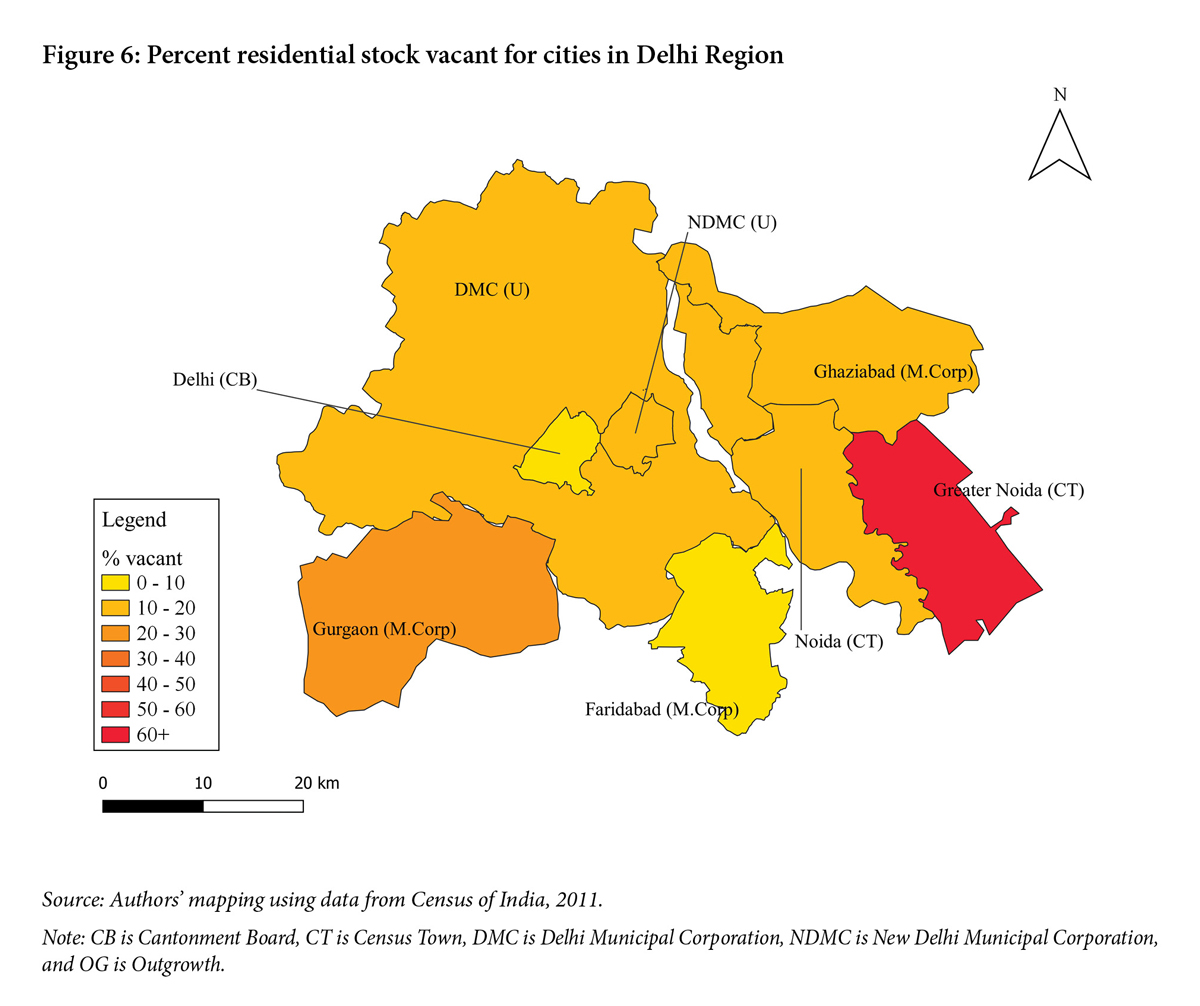
Greater Noida, in the periphery of Delhi, has the highest share of vacant houses (61%).[21] Vasai Virar in the outskirts of Mumbai has the second-highest share of vacant houses at 28%. Greater Mumbai has the highest number of vacant houses (comprising 15% of its residential housing stock), followed by Delhi and Bangalore. The state of Maharashtra, as mentioned previously, has the highest number of vacant houses (2.1 million), which make up around 19% of vacant houses in urban India. The Mumbai metropolitan region makes up 44% of the vacant houses in Maharashtra. Figure 5 shows the vacancy rate for all towns and cities in Mumbai region. Vasai Virar, Mira Bhayandar, Panvel, and Badlapur have more than 20% of their residential stock vacant, which is much more than Greater Mumbai’s.
From Figures 5 and 6, we can affirm that non-primate cities in the periphery of the metropolitan cities of Mumbai and Delhi have a much higher share of vacant housing.
This pattern could have emerged due to a high number of housing units purchased as investments but not rented out.
Definitional aspects of vacancy rates
Housing vacancies can be of two types, “intentional” and “unintentional vacancies” (Molloy, 2016, p. 118), or as Segú (2020, pp. 2-3) calls them, “voluntary” vacancy and “frictional” vacancy. Frictions in demand and supply within the housing market lead to some level of “natural” or “structural” vacancies–referred to as unintentional vacancy–even in equilibrium. The natural vacancy rate is akin to the natural unemployment rate–it is the product of a matching problem. For cities in the United States, Rosen and Smith (1983) show that when actual vacancy rates diverge from the natural vacancy rate, price adjustments in the housing market bring vacancy back to its natural rate.
Intentional vacancies occur as a rational decision by landlords to keep their units out of the rental market. Segú (2020) states two reasons for such vacancies in France: price uncertainties and rent regulations. Uncertainties in future prices could lead to owners delaying their transactions in the market, especially if the expectation is that prices will go up (Segú, 2020). Further, intentional vacancies could also be due to regulations that impede changes in rents or if there are restrictions on contract termination (Gabriel & Nothaft, 2001). In such cases, it may be rational to keep the property vacant.
Reasons for housing vacancies
Monkkonen (2019) looks at housing vacancy in the 100 largest Mexican cities and finds a strong positive correlation between government housing finance and vacancy rates. In 2010, Mexico had a housing vacancy rate of around 14%. This study found that increased access to credit directly led to new housing in the suburbs and a higher vacancy there, along with population loss in core cities.
Zhang et al. (2016) estimated that housing vacancies in parts of urban China are above 20%, leading to ghost towns. At the lower end of the income distribution, housing is beyond people’s reach because people with high incomes, who often buy multiple houses, drive up the price. Consequently, the luxury segment of the housing market sees very high vacancy rates. Zhang et al. (2016) found that a 1% increase in the GINI coefficient leads to a 0.17% increase in Chinese cities’ housing vacancies.
Without sufficient rental housing, housing markets in Indian cities are unable to meet the demand of a significant share of households who may be unable or unwilling to own homes.
There are very few studies that look at vacancy rates in private housing markets in India. Gandhi and Munshi (2017) study vacancy rates in India by looking at both public and private housing markets. They find high vacancy rates in public housing schemes by the Government of India, a finding also noted by Pande (2017). Households are reluctant to move from slums in core areas in cities to government housing in the peripheries (Barnhardt et al., 2017). Hence, these high vacancy rates may be due to households’ fear of losing their social networks. Gandhi and Munshi (2017) also find that the low returns on investments in the private rental market are a possible reason for high vacancy rates in urban India. They find gross rental yields range between 2%-4% in most Indian cities.
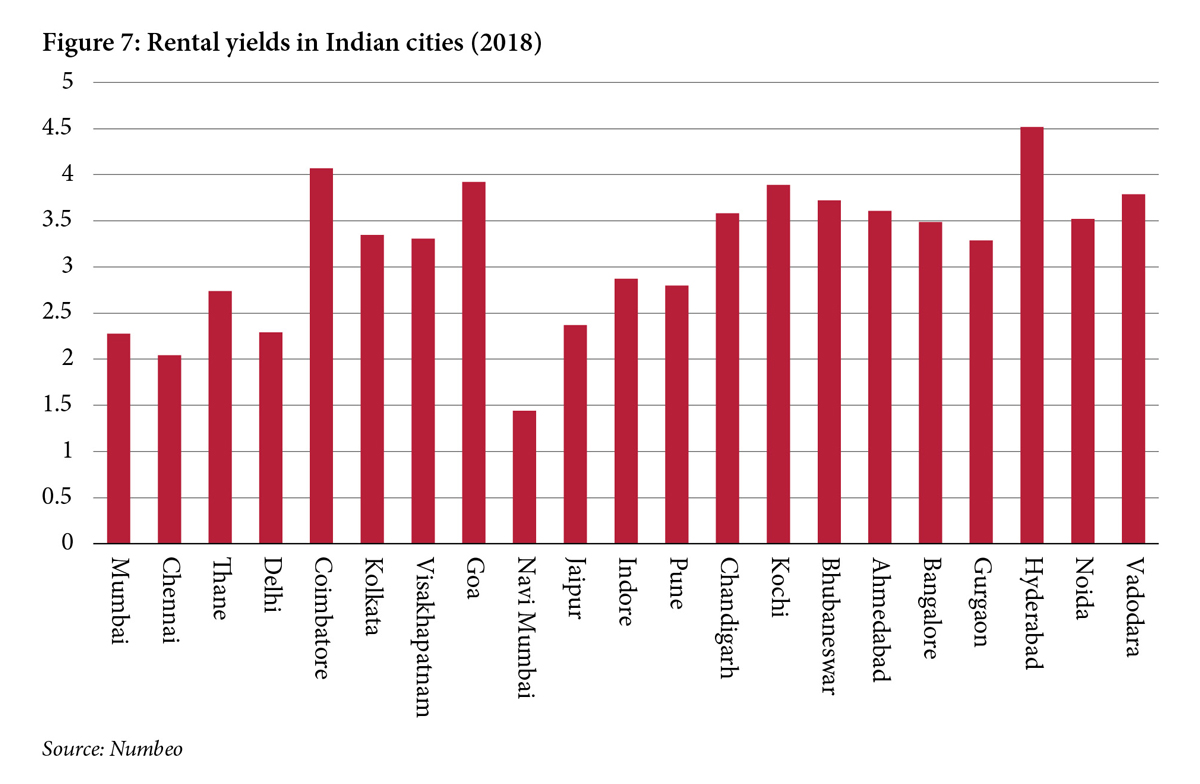
There is some evidence to back the conjecture that houses that have been purchased as investments are kept vacant due to low rental yields. Rental yields (rent as a share of property price) are the returns a landlord can get and are therefore a key determinant in the decision to invest in rental markets. We use user-contributed data available on Numbeo[22] to examine rental yields in Indian cities. Figure 7 shows that rental yields, defined as “the total yearly gross rent divided by the house price (expressed in percentages)” for representative Indian cities, are typically below 5% and range between 2 and 4%. When you compare these with risk-free returns (interest rate of fixed deposits), then these are extremely low. We note that these are gross yields; net yields will be much lower. These returns are the lowest compared to all other asset classes and therefore create no incentives for property owners to rent out. Rather, investments in property in India are typically made to gain from capital appreciation or to conceal black money.
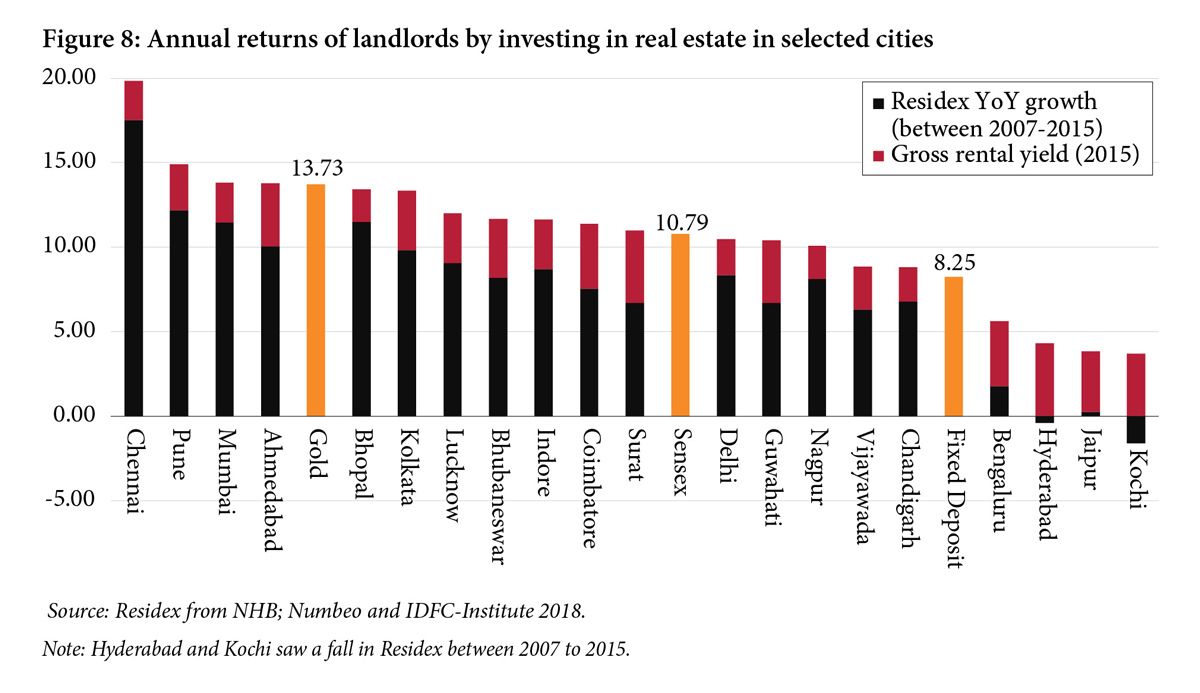
Figure 8 shows the returns to landlords from investing in real estate in selected cities. These returns are a combination of price appreciation and rental yields. Per year price appreciation is computed using Residex between 2007 to 2015 (IDFC Institute, 2018) and rental yields are from Numbeo for the year 2015. For almost all cities, cumulative returns are higher than risk-free returns provided by fixed deposits. However, the rental yields form a small portion of the returns from investing in a property.
Renting one’s property also involves risk, sources of which we discuss in this paper. We see that only property in Chennai can beat the returns from investing in gold, via price appreciation alone. Perhaps the risk-adjusted rental yields are so low that rational landlords leave homes vacant – preferring to avoid the risks involved in renting out a property altogether. We believe that in a risk-free market, a rational landlord will rent out his property to realise rental yields.
Another potential explanation for high vacancies is the existence of rampant black money flowing through real estate and land in India.
An important source of black money is the partial payment (a fixed proportion of the price of the property) made by property buyers from off-the-books sources of money. Thus, one reason for buying property is to park money that has not been declared to tax authorities. These properties are often kept vacant. Kapur and Vaishnav (2015) argue that builders use the black money to fund election campaigns, in exchange for favours and exemptions. They establish the relationship between black money and real estate by looking at trends in demand for cement. They find that demand follows a political business cycle—contracting before elections and expanding right after. Prima facie, neither low rental yields nor black money purchases should dissuade a rational agent from renting out their property. However, in the following section, we hypothesise that the nature of rent control laws and weak contract enforcement in India could discourage this.
Literature on resource misallocation
The literature on misallocation and over-consumption of housing owing to rent control is vast (Glaeser & Luttmer, 2003). Rent control leads to misallocation of housing in New York; Glaeser and Luttmer (2003) estimate that due to rent control, almost 20% of housing in the city is occupied by households that would reside elsewhere in an unregulated market. A high housing vacancy rate can reflect a distorted housing market, where land and capital are inefficiently utilised. Research explaining how rent control affects the behaviour of landlords is scant. Diamond et al. (2019 a, b) study the impact of the expansion of rent control in San Francisco and find that rent control affects landlords’ incentives such that they reduce their supply of rental housing. But no research that we know of examines the impact of rent control on vacancy rates. India has a long history of rent control in urban parts of the country (see Tandel et al., 2016), and our hypothesis is that the rent control legacy disincentivises landlords to rent out their properties, leading to a misallocation of resources. On its face, intentional vacancy seems more inefficient than even mismatch.
Developing countries are well known to have weak contract enforcement. Weak contract enforcement in India has affected how firms structure production and has led to high resource inefficiencies (Boehm & Oberfield, 2020). For example, in states where contract enforcement is weakened by overburdened courts, industries move away from relationship-specific contracts or market-based contracts to a more hierarchical and vertical production process. The rationale for this is that disputes in market-based contracts are difficult to resolve in states with weak contract enforcement. Weak contract enforcement could similarly discourage landlords from entering into leases with tenants.[23]
We hypothesise both rent control and weak enforcement of contracts are partially responsible for the high rate of vacancy in India, and for the small size of the rental market.
Empirical strategy
The paper looks at two possible reasons for urban vacant housing in India: pro-tenant rent control, and weak state capacity for contract enforcement. We also conduct a placebo test using the provision of public goods and amenities. Our unit of observation is the district. Districts are small sub-geographies of states in India and are akin to counties in the United States.
We first implement a two-way linear fixed effects panel regression design to establish a relationship between pro-tenant rent control laws and vacancy rates by estimating the following linear model:
V Hist = β · RCst + γ · Xist + θi + δt + ϵist (1)
The dependent variable in eq. (1) is the percent urban vacant housing in district i, states and year t. The years refer to 2001 and 2011. RCst is a vector of variables denoting the pro-tenant or pro-landlord nature of the rent control law. The vector of variables includes the number of months of non-payment allowed, rent revision dummy, non-occupancy dummy and coverage of the law. We describe these variables in the next section. Treated districts are where these clauses changed and the control districts are where there was no change (see Fig. 9). Xist is a vector of time-varying district characteristics. This vector includes proportion of scheduled castes and scheduled tribes, marriage, religion, workforce participation, female population share, mean household size, and the share of households with access to banking services. We also control for the per capita number of shops, and offices as well as the number of good, liveable, and dilapidated buildings per person.[24] θi and δt are district and year fixed effects, and ϵist is the error term. The parameter of interest is β, the vector of treatment effects of different rent control clauses on percent vacant housing in the district. We cluster standard errors at the district level. We also cluster at the state level for one specification.

We use OLS regression as shown in eq. (2) to look at the impact of state capacity for contract enforcement on vacancy rates in 2011.
V His = β · Judgesis + γ · Xis + ϵis (2)
State capacity for contract enforcement is measured by the number of judges per 1000 persons at the district level. To control for state-level variations, we use state dummies. Xis is a vector of district controls. We also add RCs for the year 2011 to this cross-section analysis for a few specifications. Data limitations prevent us from using panel techniques with studying the effects of judicial density on vacancy.
An issue with trying to establish this relationship is the possibility of omitted variable bias. The issue is similar to that found in the relationship between police and crime—because police are stationed in high crime areas, they may appear not to be very effective in reducing crime (Marvell & Moody, 1996). If higher vacancy is a reflection of inadequate judicial capacity, places with high vacancy might be assigned more judges. This positive correlation means that the absolute value of the observed negative coefficient on judges will be lower than the true value.
We perform a placebo test with the provision of public goods and amenities as our explanatory variables. We use a linear model similar to eq. (1), as shown in eq. (3) to estimate the vector of parameters β.
V Hist = β · PGist + γ · RCst + ζ · Xist + θi + δt + ϵist (3)
PGist is a vector of public goods consisting of the number of educational institutions per 1000 persons, medical institutions per 1000 persons, and paved roads per square kilometre in the district i, in state s, at time t, respectively. Xist is the same vector of time varying characteristics used in eq. (1). We also add the vector of rent control variables, RCst to eq. (3) for all specifications. We cluster standard errors at the district level.[25]
Vacant housing and tenure data
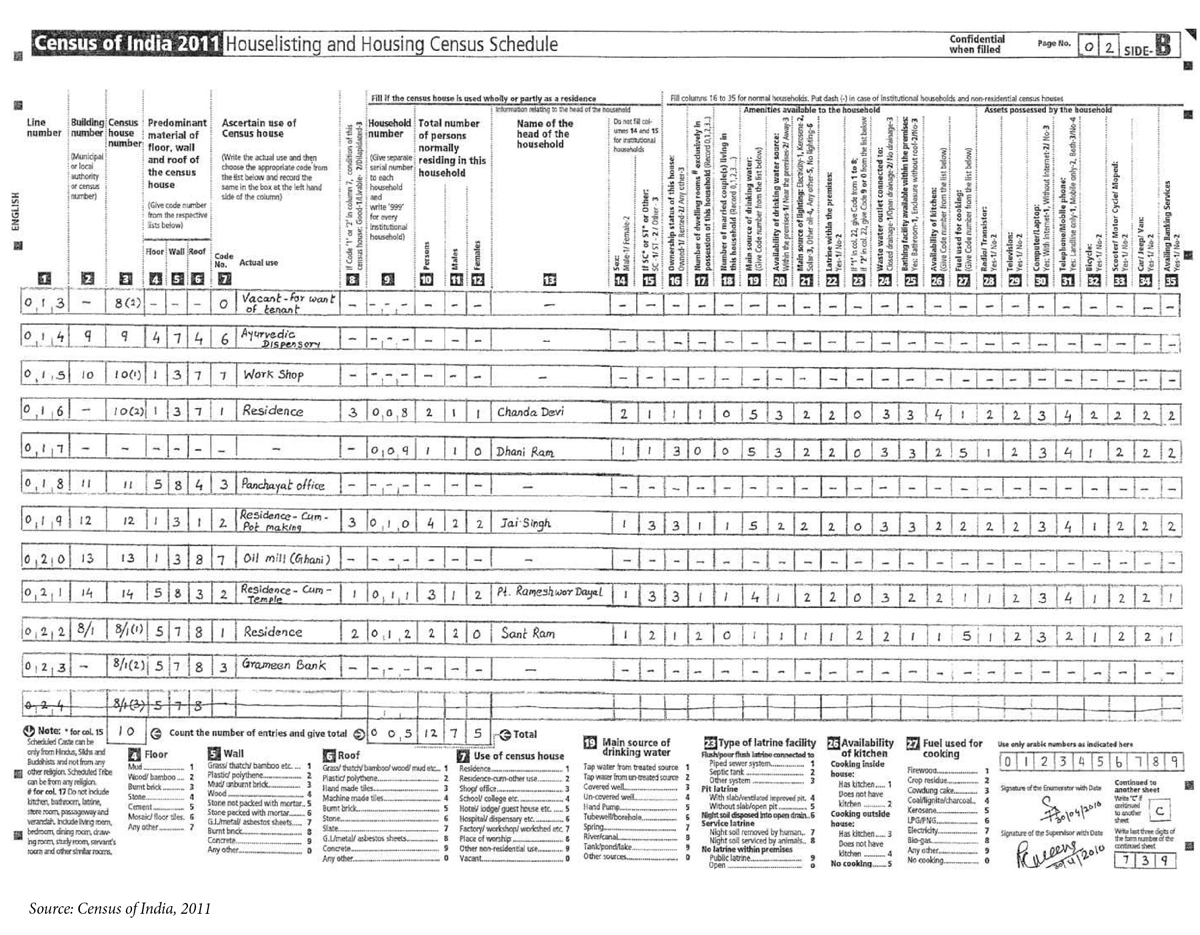
The primary source of data on vacant housing and tenure choice is the Census of India. For the censuses of 2001 and 2011, the instruction manual for House listing and Housing census enumerators defines vacant houses as:
“If a Census house is found vacant at the time of House listing i.e., no person is living in it, and it is not being used for any other non-residential purpose(s) write ‘Vacant’.”[26]
The Census of India also provides data on tenure, categorising occupied houses as rented or owned.[27] Neither vacant housing nor tenure data are available at the individual household level but are aggregated at the city and district levels. Unlike the United States, vacant houses in the Census of India are not classified by tenure status. For this study, we utilise data from 2001 and 2011 to develop panel analyses across 24 states, using percent vacant houses of urban housing stock as the dependent variable. For cross-sectional analyses of contract enforcement, we use data from 29 states.
Rent control variables
Under the Indian federal system, only state legislatures have the power to impose rent control laws. There would be a lag between passing the law and the change in the behaviour of the landlords and thus on the effect on housing outcomes. We consider a lag period of two years. For the data from 2001 and 2011 we use rent control variables up until the years 1999 and 2009, respectively.[28] We first collect historical rent control laws that would impact housing markets in 2001. For the rent control variables for 2011, we look at the Dev and Dey (2006) catalogue of rent control laws in India. There were no changes to the rent control laws between Dev and Dey (2006) and 2011.[29]
In our database, four states made changes to their rent control laws. We consider districts in these four states as the treatment group and the others as the control group. Figure 7 shows the districts (2001 boundaries) according to this classification.[30] It also shows districts dropped from our analysis due to various issues.[31]
Our variables are:
Number of months of non-payment allowed: This is calculated by adding two elements of tenant-landlord law: the minimum number of months of non-payment before a landlord can begin eviction proceedings, and the number of months the tenant has to vacate after the landlord or the rent controller issues a notice for eviction. This period of minimum non-payment varies from a fortnight to seven months.31 Laws with longer minimum periods before eviction can begin are more pro-tenant than laws with shorter periods. West Bengal and parts of Maharashtra increased the months of non-payment allowed in our time period.
Rent revision dummy: All rent control laws restrict adjustment of rents by the landlords. However, there exists variance across states in India in how strict these conditions are. Landlords in some states may raise rents annually or when the properties’ market value increases. In other states, they are subject to much stricter restrictions where they are allowed to increase rents only when they make physical additions to the property.[32] In 2001, of the 24 states considered, there was no requirement for a physical addition to raise rents in 18 states containing 287 districts. We assign these places a value of zero for the rent revision dummy. In six states consisting of 169 districts, rent increases were allowed only if the landlord made a physical addition to the premises. We assign these districts a value of one. A rent revision dummy with a value of one reflects a state with pro-tenant policy. Karnataka moved from a pro-tenant rent revision clause to a pro-landlord one.
Non-occupancy dummy: This variable looks at whether the landlord can evict the tenant if they do not occupy the unit. It takes the value 0 if it is pro-landlord, i.e., the landlord can evict the tenant in case of non-occupancy. In 2001, 15 states, or 236 districts, had a value of 0. The dummy has the value one if it is pro-tenant. i.e., if the landlord cannot evict tenants if they do not occupy the unit. Nine states, or 220 districts, take the value of one. For pro-landlord states, the time stipulated for no occupancy varies from one month to 12 months. West Bengal changed its non-occupancy clause from pro-tenant to pro-landlord.
Coverage: We control for coverage of rent control laws as they do not apply to all properties and areas. The three most common coverage types are geographical, age, and value of rent. We use a dummy variable for each, wherein the law gets a value of one if the clause has greater scope and hence is pro-tenant and 0 if it has limited scope and thus pro-landlord. The age dummy takes the value one if the law does not exclude any premises based on its age and takes the value 0 if it excludes certain properties. West Bengal and Gujarat moved from pro-tenant to pro-landlord age coverage. The rent dummy takes the value one if higher rent properties receive no exemption from rent control and takes the value 0 if there is such an exemption. The geographical dummy takes the value one if the law has jurisdiction over all urban areas and takes the value 0 if it excludes some urban areas. The geographical dummy and the rent dummy do not change between the two time periods.
Data for contract enforcement
We consider the number of judges per 1000 people at the district level as an indicator of effectiveness of courts. Data describing district courts was collected from the National Judicial Data Grid in December 2019. We used state-level totals of district-level judge strength (available for 2012) to deflate the 2019 values, estimating the 2011 judge strength with these totals as a base.[33]
Data on public goods
For the placebo test defined in eq. (3), we use measures of density for three public goods, namely educational institutions,[34] medical institutions,[35] and roads. The first two are sourced from the house listing census of 2001 and 2011. The length of paved roads in a district and its area was sourced from the “District Census Handbook,” published for each district under the Censuses of 2001 and 2011. The density of educational institutions (medical institutions) was calculated as the number of educational institutions (medical institutions) per 1000 urban population in the district. To calculate the density of paved roads, we use the length of such urban roads in the district divided by its urban area. This variable is in km. per km.2 as also used in Bird and Venables (2020).[36]
Rosen and Smith (1983) demonstrated that as much as labor markets are characterised by “natural” unemployment rates, housing markets are characterised by natural vacancy rates. The natural vacancy rate is the equilibrium rate – that is, it is the rate at which real rents neither rise nor fall. The natural rate is not zero because the housing market contains frictions, particularly with regard to search and matching.
Search and match issues increase with turnover – when people move from one housing unit to another, they create, at minimum, a short period of vacancy, as units rarely fill the instant they become vacant. A series of papers (eg. Amy et al., 2000; Eric & John, 1996; Komai, 2001; Rosen & Smith, 1983) show that a higher turnover rate leads to higher natural vacancy. Therefore, one would expect that a well-functioning housing market would have higher vacancy among renters, whose leases are finite, than owners, whose “leases” are effectively in perpetuity. Indeed, American Community Survey Data and Current Population Survey data show that (1) length of tenure in owner-occupied houses is much longer than in rental units[37] and (2) vacancy rates among rental units are much higher than among owner-occupied units.[38] Hence, it would follow that places that relied more on rental housing would have higher overall housing vacancy rates than those that relied on owning.
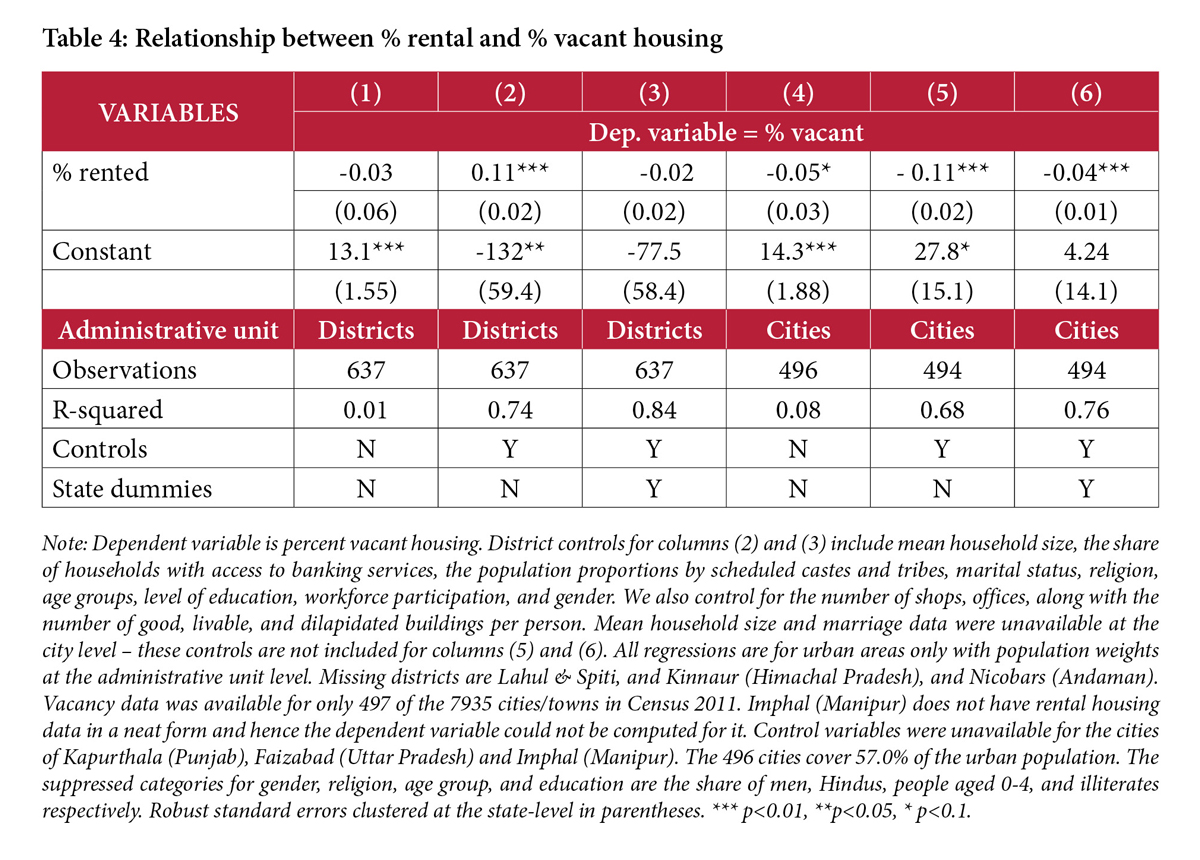
This is not the case in India. Table 4 presents regression results looking at the covariation of rental share and vacancy by district and cities in India. In column (1), at the district level with no controls, we find no relationship between rental share and vacancy, and in column (4), at the city level with no controls, we find a negative relationship significant at the 10% level. In columns (2) and (5), with controls, we find that a 1% increase in rental housing is associated with 0.11% fall in vacancy rates, with coefficients that are statistically significant at the 1% level. When we add state dummies in columns (3) and (6), the coefficient is insignificant for districts but the negative relationship remains for cities. These results are contrary to the expected positive relationship between rental share and vacancy. This could reflect the fact that renters protected by the rent control laws in India have strong tenure security, and hence, lower turnover. While these policies provide stability to those in rental units, it also reduces the appeal to property owners for renting out their units. Stringent rent control policies may explain the decline in the share of units available for rent in India over the past five decades.
Rent control
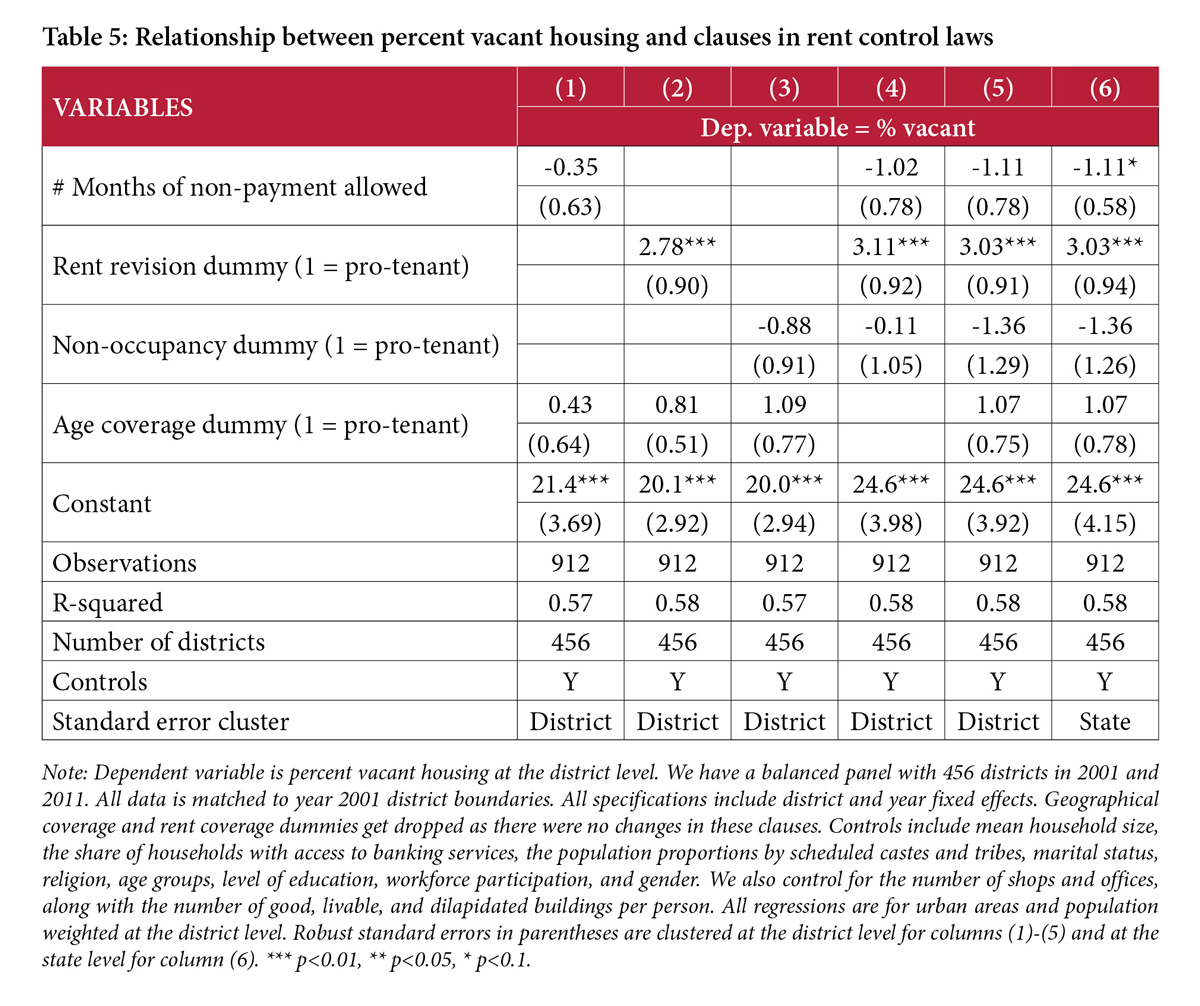
Table 5 presents how changes in various rent control measures, individually and collectively, influence housing vacancy by district in India as shown in eq. (1). Columns (1), (4), and (5) demonstrate that pro-tenant increases in the months of non-payment allowed have no significant effects on vacancy when standard errors are clustered at the district level. When standard errors are clustered at the state level, months of non-payment allowed is negative and statistically significant at 10% (column 6). The sign and the weakness of the months of non-payment coefficient may be a reflection of how long it takes for courts to enforce landlords’ claims, just as in the Madan Mohan and Anr. v. Krishan Kumar Sood (1993) and E. Palanisamy v. Palanisamy (Dead) (2003) cases. Columns (2), (4), (5), and 6) show that a limitation on landlords’ ability to raise rent freely significantly increases vacancy. In the states where rent revision clauses remained pro-tenant, the vacancy rate increased by 2.78 percentage points (Column (2)). When other changes in rent control are accounted for, this estimate increases to 3.03 to 3.11 percentage points (Columns (4), (5), and (6)). The coefficient for the non-occupancy dummy is negative and not statistically significantly different from zero in every specification we test. Changes in age coverage have no significant impact on vacancy. Taken together our results show that, a policy move that allows landlords to revise rents reduces housing vacancy.
Enforcement of contracts
According to the World Bank’s Ease of Doing Business Index, it took an average of 1,445 days to enforce a contract in India in 2019.[39] An efficient judiciary is able to resolve contractual disputes quickly, creating an enabling environment to enter into formal contracts; an inefficient judiciary reduces the frequency of contracting (Voigt, 2016). One of the ways to improve the efficiency of the judiciary system is by increasing the number of judges (Voigt, 2016). Hazra and Micevska (2004) look at the Indian legal system and find that the number of judges at the district level has a significant impact on case resolution in India and thus reduces congestion in the system.[40] Rao (2020) provides further evidence, finding that every additional judge reduces backlog by 6%. Without enough judges, the judiciary is burdened with high caseloads, affecting state capacity to enforce contracts. This makes it expensive and time-consuming to enforce a rental contract, and hence landlords prefer to avoid renting out their properties, leading to higher vacancy rates.
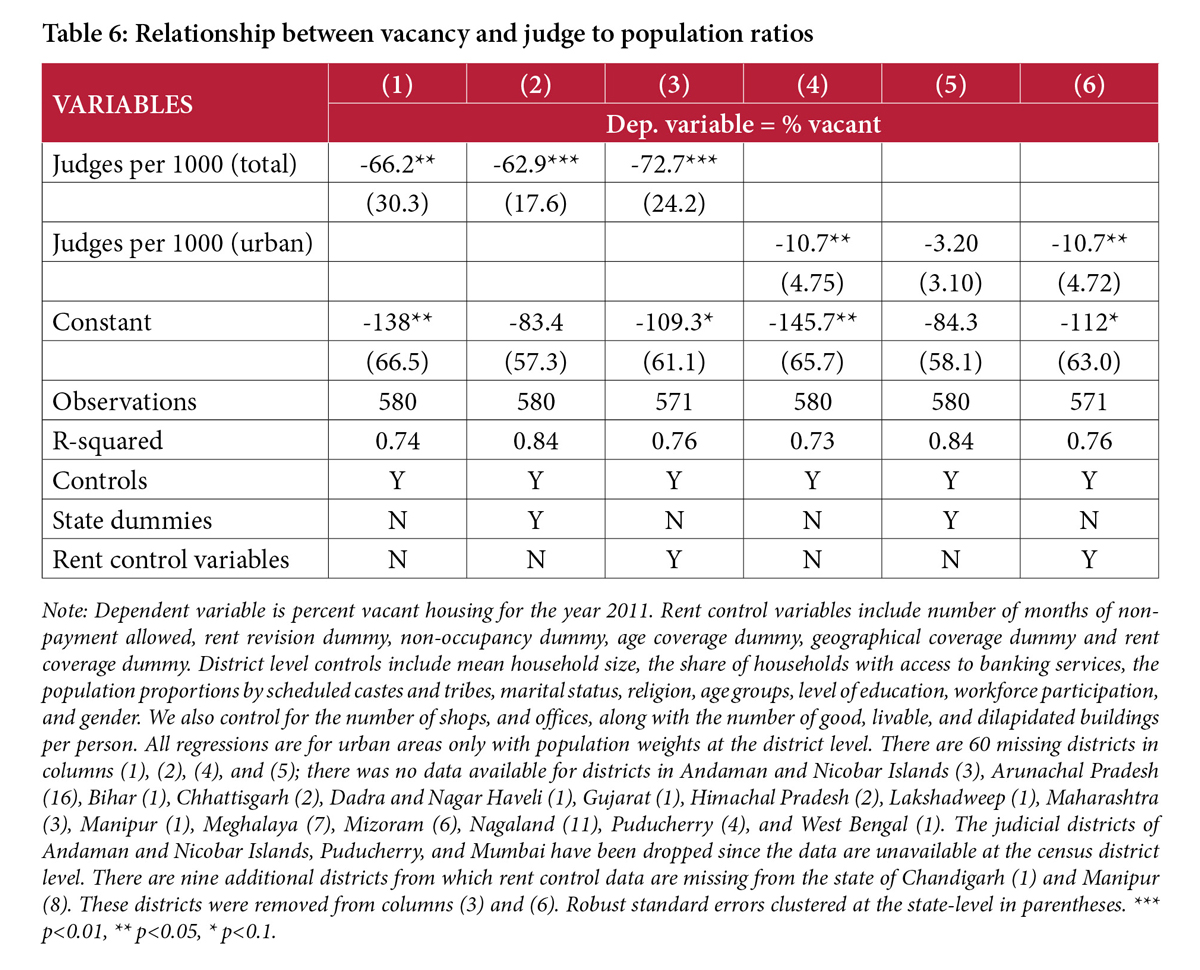
In this section, we use judge to population ratio at the district-level tertiary court as our main explanatory variable as shown in eq. (2). As these courts serve both urban and rural jurisdictions, we create two different variables – the number of judges per 1000 urban population in the district and the number of judges per 1000 total (urban and rural) population in the district. We add all rent control variables to the specifications and these results are in columns (3) and (6) of table 6. In columns (1) through (4) and column (6) of table 6, we find a significant and negative coefficient of the number of judges per 1000 population on percent vacant housing.
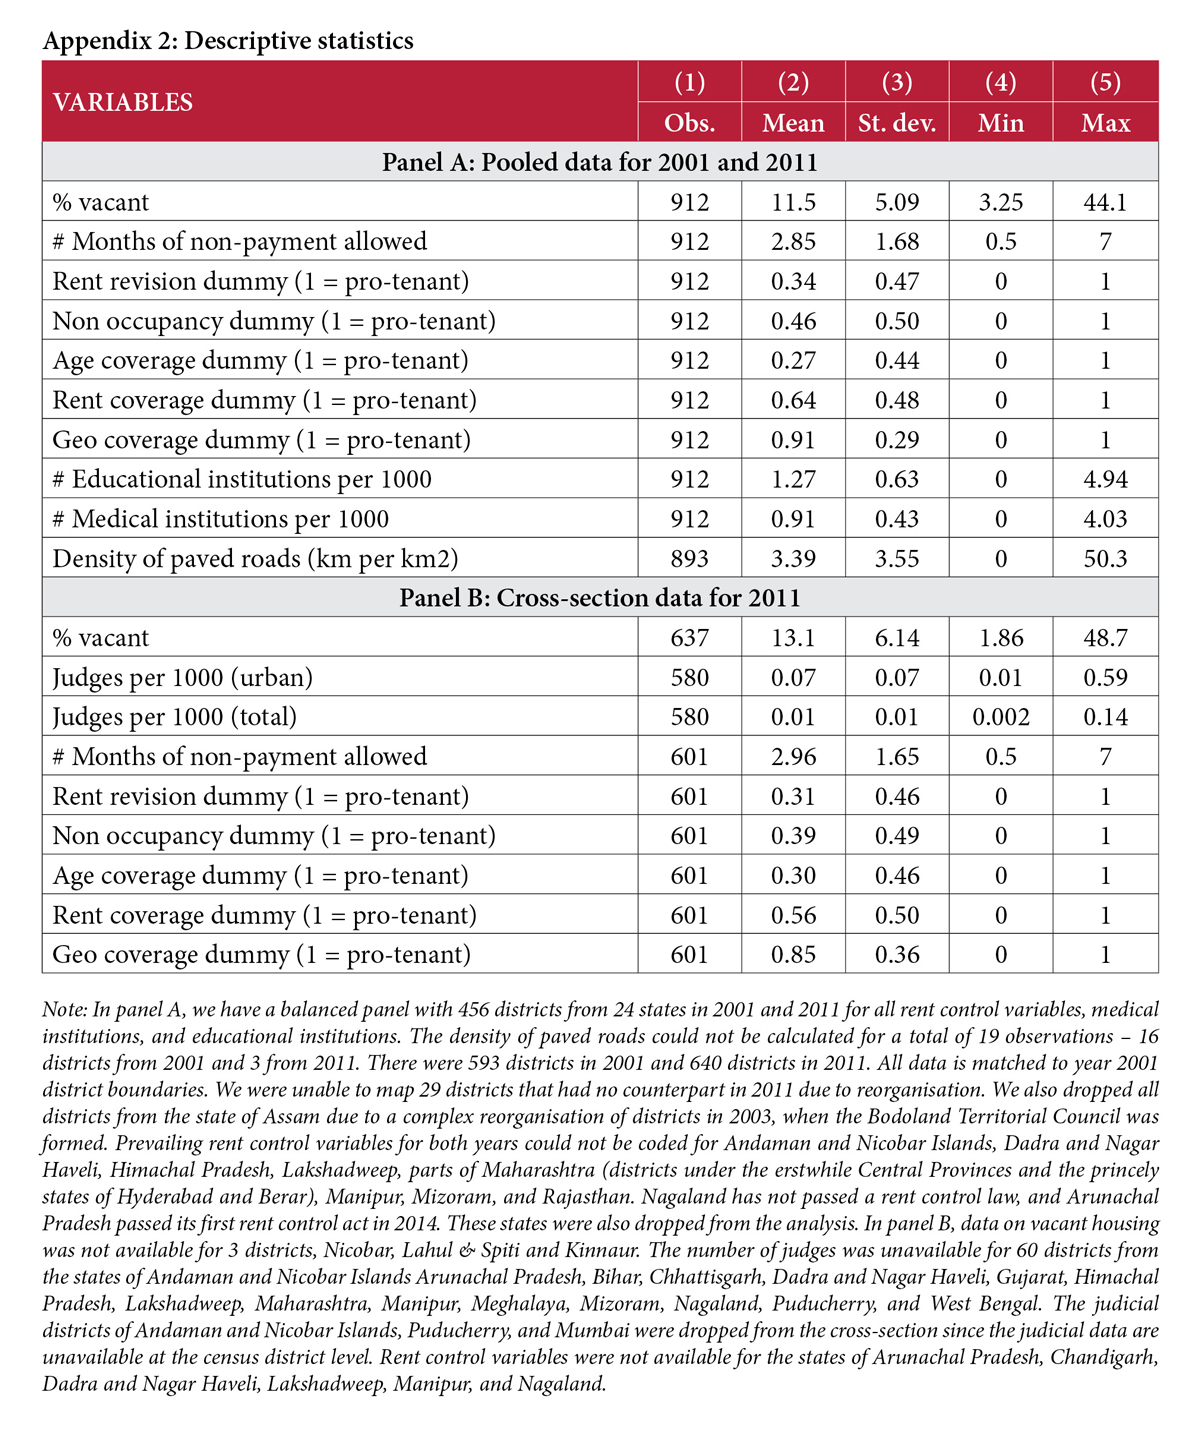
This result is consistent with the hypothesis that an absence of capacity to enforce contracts undermines the working of a rental market and incentivises owners/landlords to keep their properties vacant. Even if judges uphold landlords’ rights, it takes several years for them to do so, and potential landlords might prefer to keep their housing units vacant and avoid the problem of any legal dispute with their tenants. The Model Tenancy Act, 2021 specifically proposes a parallel judicial system focused exclusively on landlord-tenant disputes. Our findings imply that such a system, if well-staffed, could reduce vacancy. In 2012, the average number of judges per 1000 persons (total) was 0.01 (see Appendix 2). A 10% to 50% increase in judges per 1000 persons (total), could reduce vacancy by 0.1 to 0.4 percentage points (according to column (3) in table 6).[41]
Thus far, we have shown stringent rent controls and weak enforcement of contracts as predictors of high vacancy rates in Indian cities. In this section, we look at one possible placebo test for vacancy.
As seen in Figures 5 and 6, satellite cities at the peripheries of the core metropolitan cities of Mumbai and Delhi have high vacancy rates. One hypothesis is that smaller municipal bodies around the core cities have lower capacity for delivering services (Pethe, 2013; Sivaramakrishnan et al., 2014).
In a world where rent control doesn’t bind, service capacity should have no impact on vacancy, as amenities will be properly priced in rents that will produce the equilibrium vacancy rate. This is the definition of a placebo (Eggers et al., 2021).
Our results imply that it is not the presence of high-quality amenities that drive lower vacancy rates in places with liberalised rent control laws.
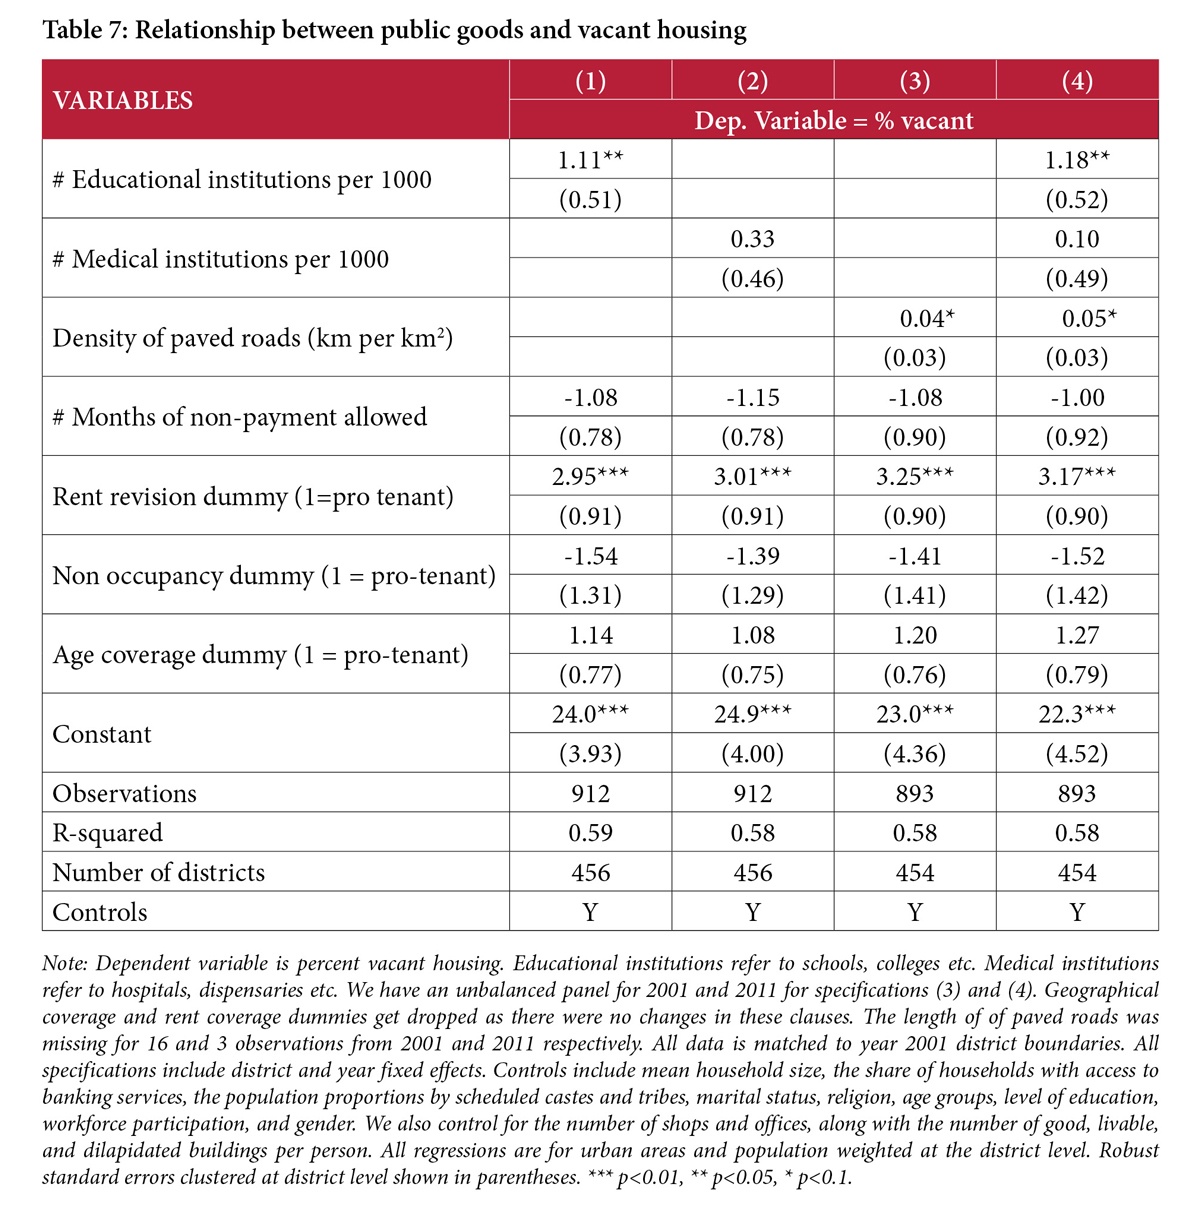
Table 7 tests these relationships between amenities and vacancy, separately as well as jointly, as specified in eq. (3). Column (1) implies that the density of educational institutes has a strong positive and significant impact on vacancy. The density of paved roads also shows a positive relationship with vacancy, significant at 10%. Column (4) from Table 7, which includes all public goods within one regression, retains these findings. So while the placebos are significant, they are significant in the wrong direction – better services produce higher vacancy. This may reinforce our central result – property owners in rent-controlled areas with good services discern greater opportunity cost for renting out their properties.
We also add rent control variables in these specifications. The rent revision dummy remains positive and significant throughout. Number of months of non-payment and the non-occupancy dummy are not significant.
Ministry of Housing and Urban Poverty Alleviation, Government of India (2012), estimated the housing shortage to be 18.8 million units. We have found that the elimination of rent revision reduces vacancy by 2.8 to 3.1 percentage points. We make use of the conservative estimate of 2.8 percentage points as our preferred coefficient in this section. Moving to a pro-landlord clause in rent revision would bring vacant units into the rental market, which could reduce the housing shortage. We estimate that the housing shortage would drop as much as 7.5% in states that liberalize their rent revision laws.
We now compute the welfare gains from the elimination of rent control. The average vacancy rate in India as per the Census of India 2011 is 12.4 percent, meaning that the occupancy rate is 87.6 percent. Reducing vacancy in India by 2.8 percentage points is the same thing as increasing the number of occupied units by .028/.876, or 3.2 percentage points.
Dutta et al. (2021) find that the ten-year supply elasticity for housing in India is 1.64. From this, we may pin down the increase in price that will bring us to equilibrium—rents would rise by .032/1.64, or 1.9 percent. Using the standard formula for deadweight loss:
DWL = (P2−P1) · (Q1−Q2)/0.5 (4)
where DWL is deadweight loss and the prices and quantities subscripted with one are market outcomes and the prices and quantities subscripted with two are rent controlled outcomes, we find that the welfare gain is .019*.031*.5 = .00029. There are some caveats to this calculation. Our calculations underestimate the resultant welfare gains from the elimination of rent control. Our estimate of welfare gain is static, and only takes into account vacancy of the current housing stock. It does not consider housing that was never, or might never be, built because of rent control laws. Further, it does not consider the complete relaxation of rent restrictions in India. The gains would be larger if we considered the dynamic implications and the full freedom for landlords to adjust rents.
This focuses on potential policy responses for India, while also looking at the experience of some cities/countries in implementing the suggested strategies. We also discuss the deficiencies in the data available for India and ways to improve data collection and reporting.
Tenancy law and contract enforcement
This study highlights the need for reform in two major systems – the governance of rental contracts and the processes for enforcement of these contracts.
Pro-tenant legislation reduces the incentives of landlords to let out their premises, forgoing possible welfare gains. We recommend that states with such legislation improve the balance between incentives to landlords with the rights of the tenants.
Specifically, according to our analysis, states need to ensure that the landlords are able to revise rents freely. As mentioned in the last section, we estimate that such a change would reduce the housing shortage by as much as 7.5% in states with illiberal rent revision laws.
Reform of rent legislation in order to reduce vacant housing has taken place in the past in Egypt, where rent control was abolished in 1996. However, pre-1996 rent contracts were grandfathered into the new regime. This move incentivised multi-generational rent contracts, and reduced the impact of the abolition of rent control. As a consequence, the reduction of vacant housing has been minimal. Therefore, for reform to be impactful, it must take into account the legacy of the old rent control law.
The second major challenge we find in this study is the state’s poor state capacity for enforcement of contracts. Landlords face tedious litigations if there arises a dispute between them and the tenant. Thus, they fear the loss of property and revenue. In part due to too few district-level judges – poor state capacity harms the rental market as well as all other markets.
Since the latest information on vacant houses was available only for 2011, we take into account changes in these laws only up to 2011. Since then, nine states have passed new rent control laws and amended them. The cabinet also approved the Model Tenancy Act, 2021 (MTA), which takes important steps in the direction of balancing the rights of tenants and landlords. The states have a financial incentive in the form of central funds for public housing dependent on the adoption of this Act (as is or in a modified form). This strategy has been used earlier to encourage the adoption of the Model Tenancy Act 1993 and other reforms.
The MTA 2021 removes government regulation over revision and setting of rent. It also envisions a separate system of dispute resolution at the district level for all matters falling under its jurisdiction. It also places a 60-day deadline on case resolution. This novel, time-bound method of dispute resolution may well reduce the legacy of old rent control legislation and increase incentives for landlords to rent out their property. Effective implementation of the act will be key to its success.
Time for a vacant housing tax?
The issue of vacant housing is not a uniquely Indian one. Many cities and countries face the same challenge and have implemented policy measures to address the same. Washington DC, Vancouver, Oakland, and French municipalities have all levied a vacant housing tax with varying degrees of success. The reduction of vacant housing has been directly linked to the tax only in Vancouver (Housing Vancouver, 2020) and France (Segu 2020), and vacancy taxes have high investments attached to them (Vancouver Sun, 2019).
A vacancy tax along with regulatory incentives for homeowners who rent their homes should be considered for India. This would nudge the homeowners to rent their houses, while the rent control and judicial reforms would assure them of the security of their investments. However, we need a deeper analysis of the situation and a way to identify vacant housing annually before suggesting such a measure for India.
A data plan for India
Lastly, a major challenge faced during this study was the lack of a comprehensive database of vacant houses. The census is the only database that counts vacant houses, but it lacks in three major fronts – geographical depth, reasons for the vacancy, and frequency. We recommend that the Ministry of Statistics and Program Implementation include status and characteristics of housing (especially vacancy and its causes) in its annual National Sample Surveys, an analogue of the American Community Survey – which provides similar data for the USA. Another response to the scarcity of data will be to include vacancy statistics for various submarkets in the Residex by the National Housing Bank or increase access to urban housing data by the Ministry of Housing and Urban Affairs (MHUA).
It is important that the census accounts for the reasons for vacancy during the course of the house-listing survey as well. While the smallest aggregation of census data is the “enumeration block”, house-listing information, especially on use of buildings, is available only at the city level, and only for 496 cities. Geographically disaggregated information at a ward or enumeration block level from the house-listing stage of the census will go a long way in bridging the information gaps in India’s housing sector. This would allow researchers to conduct more nuanced analyses and suggest targeted policies.
This paper examines the characteristics and possible explanations for urban vacant housing in India. The U.S. experience would lead us to expect cities that relied more on rental housing to have higher overall housing vacancy rates than those that relied on owning. However, this is not the case in India.
We find two explanations for vacancy rates: pro-tenant rent control laws and the size of the contract enforcement infrastructure. We exploit changes in the rent control laws in the Indian states of West Bengal, Karnataka, Gujarat, and Maharashtra to establish a relationship between pro-tenant rent control laws and vacancy rates in districts between 2001 and 2011. Our results show that a pro-landlord policy move that relaxes rent revisions reduces housing vacancy by 2.8 to 3.1 percentage points. Poor contract enforcement, measured by number of judges normalized by population, is negatively related with vacancy rates. Given high vacancy rates in the peripheries of large cities, we also consider that levels of public goods and amenity provision may explain differences in vacancy rates across cities and districts. This may be considered a placebo test. We construct a panel of public goods and amenities data for the years 2001 and 2011 and find a positive relationship between public goods and vacancy. This is consistent with property owners tending to be reluctant to rent out their properties in more desirable areas.
The findings of our paper indicate that rent control reform and judicial capacity are two areas requiring the urgent attention of policymakers in India. We estimate that a policy change in rent control laws would have a net welfare benefit and could reduce the housing shortage in India by 7.5%. Given that it simultaneously has a small number of formal housing units per family by world standards and a high vacancy rate, India can almost surely allocate its housing resources more efficiently and equitably.
Allen, K. (2014). Housing divide widens with more empty homes and crowding. The Financial Times, May 29.
Amy, K., Ming, Y. S., and Yuan, L. L. (2000). The natural vacancy rate of the Singapore office market. Journal of Property Research, 17(4):329–338.
Arnott, R. (1988). Rent control: the international experience. The Journal of Real Estate Finance and Economics, 1(3):203–215.
Arnott, R. (1995). Time for revisionism on rent control? Journal of Economic Perspec- tives, 9(1):99–120.
Badger, E. (2017). When the (empty) apartment next door is owned by an oligarch. The New York Times, July 21.
Barnhardt, S., Field, E., and Pande, R. (2017). Moving to opportunity or isolation? network effects of a randomized housing lottery in urban India. American Economic Journal: Applied Economics, 9(1):1–32.
Bertaud, A. (2010). Land markets, government interventions, and housing affordability. Working Paper 18, Wolfensohn Center For Development at the Brookings Institution.
Bird, J. and Venables, A. J. (2020). Land tenure and land-use in a developing city: A quantitative spatial model applied to Kampala, Uganda. Journal of Urban Economics, 119:103268.
Boehm, J. and Oberfield, E. (2020). Misallocation in the market for inputs: Enforcement and the organization of production. The Quarterly Journal of Economics, 135(4):2007– 2058.
Brueckner, J. K. and Sridhar, K. S. (2012). Measuring welfare gains from relaxation of land-use restrictions: The case of India’s building-height limits. Regional Science and Urban Economics, 42(6):1061–1067.
Caru, V. (2013). Circumstantial Adjustments: The Colonial State, the Nationalist Move- ment, and Rent Control Legislation (Bombay, 1918-1928). Le Mouvement Social, 242(1):81–95.
Chandran, R. (2018). Millions of empty homes, but migrants to Indian cities cannot rent them. Reuters, February 2.
Cheshire, P., Hilber, C. A., and Koster, H. R. (2018). Empty homes, longer commutes: the unintended consequences of more restrictive local planning. Journal of Public Economics, 158:126–151.
Dev, S. and Dey, P. D. (2006). Rent Control Laws in India: A Critical Analysis. Working Paper 06-04, National Institute of Urban Affairs, New Delhi.
Diamond, R., McQuade, T., and Qian, F. (2019a). The effects of rent control expansion on tenants, landlords, and inequality: Evidence from San Francisco. American Economic Review, 109(9):3365–94.
Diamond, R., McQuade, T., and Qian, F. (2019b). Who Pays for Rent Control? Het- erogeneous Landlord Response to San Francisco’s Rent Control Expansion. In AEA Papers and Proceedings, volume 109, pages 377–80.
Dutta, A., Gandhi, S., and Green, R. K. (2021). Distant shocks, migration, and housing supply in India. SSRN working paper.
Economist (2019). Proposals to tax pieds-à-terre in New York are gaining ground. The Economist, March 16.
Eggers, A. C., Tuñón, G., and Dafoe, A. (2021). Placebo tests for causal inference.
Technical report, Working paper.
Eric, B. and John, G. (1996). Explaining the vacancy rate-rent paradox of the 1980s.
Journal of Real Estate Research, 11(3):309–323.
Gabriel, S. A. and Nothaft, F. E. (2001). Rental housing markets, the incidence and dura- tion of vacancy, and the natural vacancy rate. Journal of Urban Economics, 49(1):121– 149.
Gandhi, S. and Munshi, M. (2017). Why are so many houses vacant.
Gandhi, S. and Phatak, V. K. (2016). Land-based financing in metropolitan cities in India: The case of Hyderabad and Mumbai. Urbanisation, 1(1):31–52.
Gandhi, S., Tandel, V., Tabarrok, A., and Ravi, S. (2021). Too Slow for the urban march: Litigations and the real estate market in Mumbai, India. Journal of Urban Economics, 123:1–14.
Glaeser, E. L. (2021). What can developing cities today learn from the urban past?
Regional Science and Urban Economics, page 103698.
Glaeser, E. L. and Luttmer, E. F. (2003). The misallocation of housing under rent control.
American Economic Review, 93(4):1027–1046.
Hazra, A. K. and Micevska, M. B. (2004). The problem of court congestion: Evidence from Indian lower courts. Technical report, ZEF Discussion Papers on Development Policy.
Housing Vancouver. (2020). Empty Homes Tax Annual Report 1st January, 2018 to 31st December, 2018 Tax Year, City of Vancouver. https://vancouver.ca/files/cov/vancouver-2019-empty-homes-tax-annual-report.pdf, accessed 21st September, 2020
IDFC Institute (2018). India Infrastructure Report 2018: Making Housing Affordable.
IDFC.
Jauhar, D. (1995). Exploring unfairness of fair: paradoxes of fair rent fixation under Punjab Rent Act. Journal of the Indian Law Institute, 37(2):209–221.
Kapur, D. and Vaishnav, M. (2015). Builders, politicians, and election finance. Costs of Democracy: Political Finance in India, pages 74–118.
Kaul, V. (2015). Why are more than 10 million homes vacant in India? BBC News, May 21.
Komai, M. (2001). Vacancy and the Price Adjustment Mechanism for Housing Markets in Japan. In Asian Real Estate Society Sixth Annual Conference. Citeseer.
Krishna, A., Rains, E., and Wibbels, E. (2020). Negotiating Informality–Ambiguity, Intermediation, and a Patchwork of Outcomes in Slums of Bengaluru. The Journal of Development Studies, 56(11):1983–1999.
Marvell, T. B. and Moody, C. E. (1996). Specification problems, police levels, and crime rates. Criminology, 34(4):609–646.
Marx, B., Stoker, T., and Suri, T. (2013). The economics of slums in the developing world. Journal of Economic perspectives, 27(4):187–210.
Ministry of Finance, Government of India (2018). The economic survey of India (2017-18).
Ministry of Housing and Urban Poverty Alleviation, Government of India (2012). Report of the technical group on urban housing shortage (TG-12).
Molloy, R. (2016). Long-term vacant housing in the united states. Regional Science and Urban Economics, 59:118–129.
Monkkonen, P. (2019). Empty houses across North America: Housing finance and Mex- ico’s vacancy crisis. Urban Studies, 56(10):2075–2091.
Nakamura, S. (2016). Revealing invisible rules in slums: The nexus between perceived tenure security and housing investment. Habitat International, 53:151–162.
Numbeo (2021). Property prices index by city 2021. https://www.numbeo.com/ property-investment/rankings.jsp. (accessed February 23, 2021).
Pande, R. (2017). Constructing housing for the poor without destroying their communities.
Pethe, A. (2013). Metropolitan public finances: The case of Mumbai. Government Finance in Metropolitan Areas in Developing Countries, pages 243–272.
Rao, M. (2020). Judges, lenders, and the bottom line: Court-ing firm growth in india. http://manaswinirao.com/files/manaswini_jmp.pdf.
Reyes, A. (2020). Mexico’s housing paradox: Tensions between financialization and access. Housing Policy Debate, pages 1–26.
Rosen, K. T. and Smith, L. B. (1983). The price-adjustment process for rental housing and the natural vacancy rate. The American Economic Review, 73(4):779–786.
Segú, M. (2020). The impact of taxing vacancy on housing markets: Evidence from france. Journal of Public Economics, 185:104079.
Sharma, A. (2017). Why rent agreements are usually of 11 months only. Livemint, October 12.
Siddiqi, F. J. (2013). Governing urban land: the political economy of the ULCRA in Mumbai. PhD thesis, Massachusetts Institute of Technology.
Sivaramakrishnan, K. C. et al. (2014). Governance of megacities: Fractured thinking, fragmented setup. OUP Catalogue.
Siwach, S. (2018). 1 in 5 city properties lying vacant. The Times of India, March 30.
Sridhar, K. S. (2010). Impact of land use regulations: Evidence from india’s cities. Urban Studies, 47(7):1541–1569.
Struyk, R. J. (1988). Understanding high housing vacancy rates in a developing country: Jordan. The Journal of Developing Areas, 22(3):373–380.
Tandel, V., Patel, S., Gandhi, S., Pethe, A., and Agarwal, K. (2016). Decline of rental housing in India: The case of Mumbai. Environment and Urbanization, 28(1):259–274.
Tembe (1976). Report of the rent acts enquiry committee. Report, Government of Maharashtra, Bombay: The Government Central Press.
United Nations (2018). World urbanization prospects: The 2018 revision.
Vancouver Sun (2019) Andrey Pavlov: Vacancy tax a good idea that’s been badly implemented. Vancouver Sun, 1st February. https://vancouversun.com/opinion/op-ed/andrey-pavlov-vacancy-tax-a-good-idea-thats-been-badly-implemented, accessed 22nd September 2020.
Voigt, S. (2016). Determinants of judicial efficiency: A survey. European Journal of Law and Economics, 42(2):183–208.
Zhang, C., Jia, S., and Yang, R. (2016). Housing affordability and housing vacancy in China: The role of income inequality. Journal of Housing Economics, 33:4–14.
FOOTNOTES
[1] See Badger (2017) in the New York Times; Allen (2014) in the Financial Times; Economist (2019).
[2] See Kaul (2015) in BBC; Chandran (2018) in Reuters; Siwach (2018) in The Times of India.
[3] As per Ministry of Housing and Urban Poverty Alleviation, Government of India (2012) the housing shortage in Indian cities is estimated to be at around 18.8 million units.
[4] For instance, relative to income, Mumbai has the ninth highest house prices in the world (Numbeo, 2021).
[5] Comparing time taken to enforce contracts across 190 countries, Greece is the lowest ranked developed country, with a rank of 145. India ranks 163. See: https://www.doingbusiness.org/en/data/exploretopics/enforcing-contracts
[6] The chapter titled “Industry and Infrastructure” in Volume II of the Economic Survey 2017-18 (see Ministry of Finance, Government of India, 2018)
[7] One prevalent land use regulation in Indian cities is a limit on the floor area ratio allowed. Local bodies raise considerable revenues by charging for larger floor area ratio allowances (see Gandhi and Phatak, 2016).
[8] Data from the National Sample Survey Organisation of India (2012) shows that 31.8% and 35.9% of households are living in rental accommodation in slums and formal housing, respectively. The difference in census and sample survey numbers is because one is the entire population and the other is a sample. The census collects data from all households in the country and is reliable for understanding aggregate numbers, whereas the national sample survey numbers are stratified and based on only a sample 0.05% of the households in urban India and hence could miss several pockets within large cities. For example, in Mumbai the sample survey only covers 611 households and could under represent pockets that have more ownership.
[9] See Krishna et al. (2020) for more details on written rental agreements in slums.
[10] Caru (2013) provides a history of the introduction of the rent control act in Bombay in 1918.
[11] We refer to cities and states as they were named at the time of the law.
[12] (1993) SCR (1) 107.
[13] In Himachal Pradesh, the tenant is allowed to be in default of three months’ rent before they can be evicted. In this case, the Rent Controller provided the tenant two separate opportunities to pay their dues. Aggrieved by this leniency, the landlord appealed to the High Court, which rejected his appeal. Therefore, the landlord appealed to the Supreme Court to evict the tenant and prevailed.
[14] (2003) 1 SCC 123.
[15] Some other key Supreme Court judgements with respect to evictions in favor of the landlord are in the states of Uttar Pradesh (1978 AIR 287) and Rajasthan ((2003) 2 SCC 577).
[16] These conditions can be on the frequency of increases or when the property is improved. Other common justifications are increase in taxes on the property and increase in the market value of the property. However, some states allow for periodical revisions in rent as well.
[17] 2002 (2) BomCR 76.
[18] Given the strict rent control laws and shortage of housing in Bombay in the mid 1900’s, landlords (or tenants) started renting (or subletting) out their property for a period of 11 months, which would not come within the purview of the rent control law. However, the Government of Maharashtra, with a small amendment in 1973 (Maharashtra Act XVII of 1973), made it very difficult to evict tenants under these agreements, granting these tenants de facto rent control.
[19] Background note available here: http://mohua.gov.in/upload/uploadfiles/files/1%20Background% 20Note%20on%20MTA%20(English).pdf
[20] Among all the states and union territories of India, Goa has the highest share of vacant houses at 31.3%.
[21] Greater Noida is classified as a census town. Census towns are areas that have urban characteristics but lack an urban local body. In practice, Greater Noida was created as an industrial development area, and is governed by an industrial development authority.
[22] Numbeo is a crowd-sourced global database with information on housing indicators, quality of healthcare, among other indicators of quality of life. The database is available here https://www.numbeo.com/cost-of-living/
[23] Weak contract enforcement in India has increased the amount of litigation against real estate projects through NIMBYism, which has increased construction times by 20% (Gandhi et al., 2021).
[24] Detailed descriptions of how these control variables are enumerated can be found in the Metadata for Census of India 2011. See: https://censusindia.gov.in/2011census/HLO/Metadata_Census_2011. pdf
[25] We considered a border discontinuity design as an empirical strategy but do not have sufficient degrees of freedom to run this.
[26] While the manual instructs the enumerator to note the reason for vacancy, the Registrar General of India does not release these data. Column 7 of the Census Houselisting questionnaire has enumeration categories for vacancy (see Appendix 1.)
[27] There is also a third category, “other,” that refers to premises that are neither owned nor rented. This category includes houses provided by an employer rent-free, houses constructed on encroached land, unauthorized buildings, and natural shelters used as housing. Only 3.30% of houses in urban India are classified thus.
[28] West Bengal amended its act in 1997 and it came into effect on December 28,1998. We are treating this as if it is 1999. This act would have no impact on housing vacancy in 2001.
[29] The Jawaharlal Nehru National Urban Renewal Mission in 2005 mandated changes to the rent control laws to avail transfers from the centre. Many states amended their laws after 2011. Between 2011 and 2020, nine states have passed new rent control laws or amended them.
[30] The count of districts is 593 in 2001 and 640 in 2011. New districts formed between 2001 and 2011 are mostly the result of one district being broken into two or more. Complete data on vacancy is not available below district level in the 2001 and 2011 censuses. Therefore, in order to create a balanced panel, we had to merge 2011 districts to recreate 2001 boundaries. In the end, we dropped 29 districts from 2001 that had no counterpart in 2011.
[31] Assam underwent a complex reorganisation of districts in 2003, when the Bodoland Territorial Council was formed. We drop the state from our analysis because the boundaries of the districts changed significantly. We could not find the texts of current or past rent control laws of Andaman and Nicobar Islands, Dadra and Nagar Haveli, Himachal Pradesh, Lakshadweep, parts of Maharashtra (districts under the erstwhile Central Provinces and the princely states of Hyderabad and Berar), Manipur, Mizoram, and Rajasthan. Nagaland has not passed a rent control law, and Arunachal Pradesh passed its first rent control act in 2014. These states were also dropped from the analysis.
[32] These time periods are given in months and fortnights. The variable, number of months of non-payment, takes the values of 0.5,1,2,3,4,5, and 7.
[33] The vacant housing data are from the Census of India 2011. For 2019, we do not have data for Arunachal Pradesh, Nagaland and parts of Meghalaya. We make use of 2012 state-level data on the number of tertiary level judges to create deflators. The number of judges for 2012 with and without the above mentioned three states are 14,432 and 14,393 respectively. The number of judges for the year 2019 omitting the three states is 15,873. We used data on the number of judges by state in 2012 to deflate the 2019 dataset to create an estimate of number of judges for each district in 2012. Our strong assumption is that within each state, the proportion of judges by district remains constant between 2012 and 2019.
[34] The census counts them as “schools/colleges etc.”
[35] The census counts them as “hospitals/dispensaries etc.”
[36] The length of paved roads and/or the area of the district was not available for 16 observations from 2001 and 3 observations from 2011. Therefore, panels using this variable are unbalanced.
[37] The median renter in the U.S. in 2018 had lived in their unit for less than three years, while the median owner had lived in their unit for considerably more than 9 years. The categories in the ACS questionnaire prevent us from expressing the difference more precisely. URL: https://data.census.gov/cedsci/table?q=Year%20Householder%20Moved%20Into%20Unit&hidePreview=false&t=Year%20Householder%20Moved%20Into%20Unit&tid=ACSDT1Y2018.B25038&vintage=2018, accessed July 19, 2020.
[38] See https://www.census.gov/housing/hvs/index.html, accessed July 19, 2020
[39] See: https://www.doingbusiness.org/en/data/exploretopics/enforcing-contracts
[40] Increasing the number of judges does not increase in the efficiency of the courts in all countries (Voigt, 2016), but it does in India (Rao, 2020).
[41] The fall in vacancy due to a 10% to 50% increase in judges would be similar even if we take the coefficient from column (6) in table 6.


Find on this page
The Centre for Social and Economic Progress (CSEP) is an independent, public policy think tank with a mandate to conduct research and analysis on critical issues facing India and the world and help shape policies that advance sustainable growth and development.