
Mapping India and China’s Clean Energy Trade in South Asia: Sri Lanka and Nepal
Reading Time: 5 minutesEditor's Note
This is the second blog in a two-part CSEP series examining trends in clean energy component imports across Bangladesh, Sri Lanka, and Nepal. Building on the first part, which examined the broader context of CE trade and import trends across solar photovoltaic, wind turbine, and rechargeable lithium-ion battery components in Bangladesh, this blog analyses import trends in Sri Lanka and Nepal before exploring the broader implications of these trade patterns for India and the region.
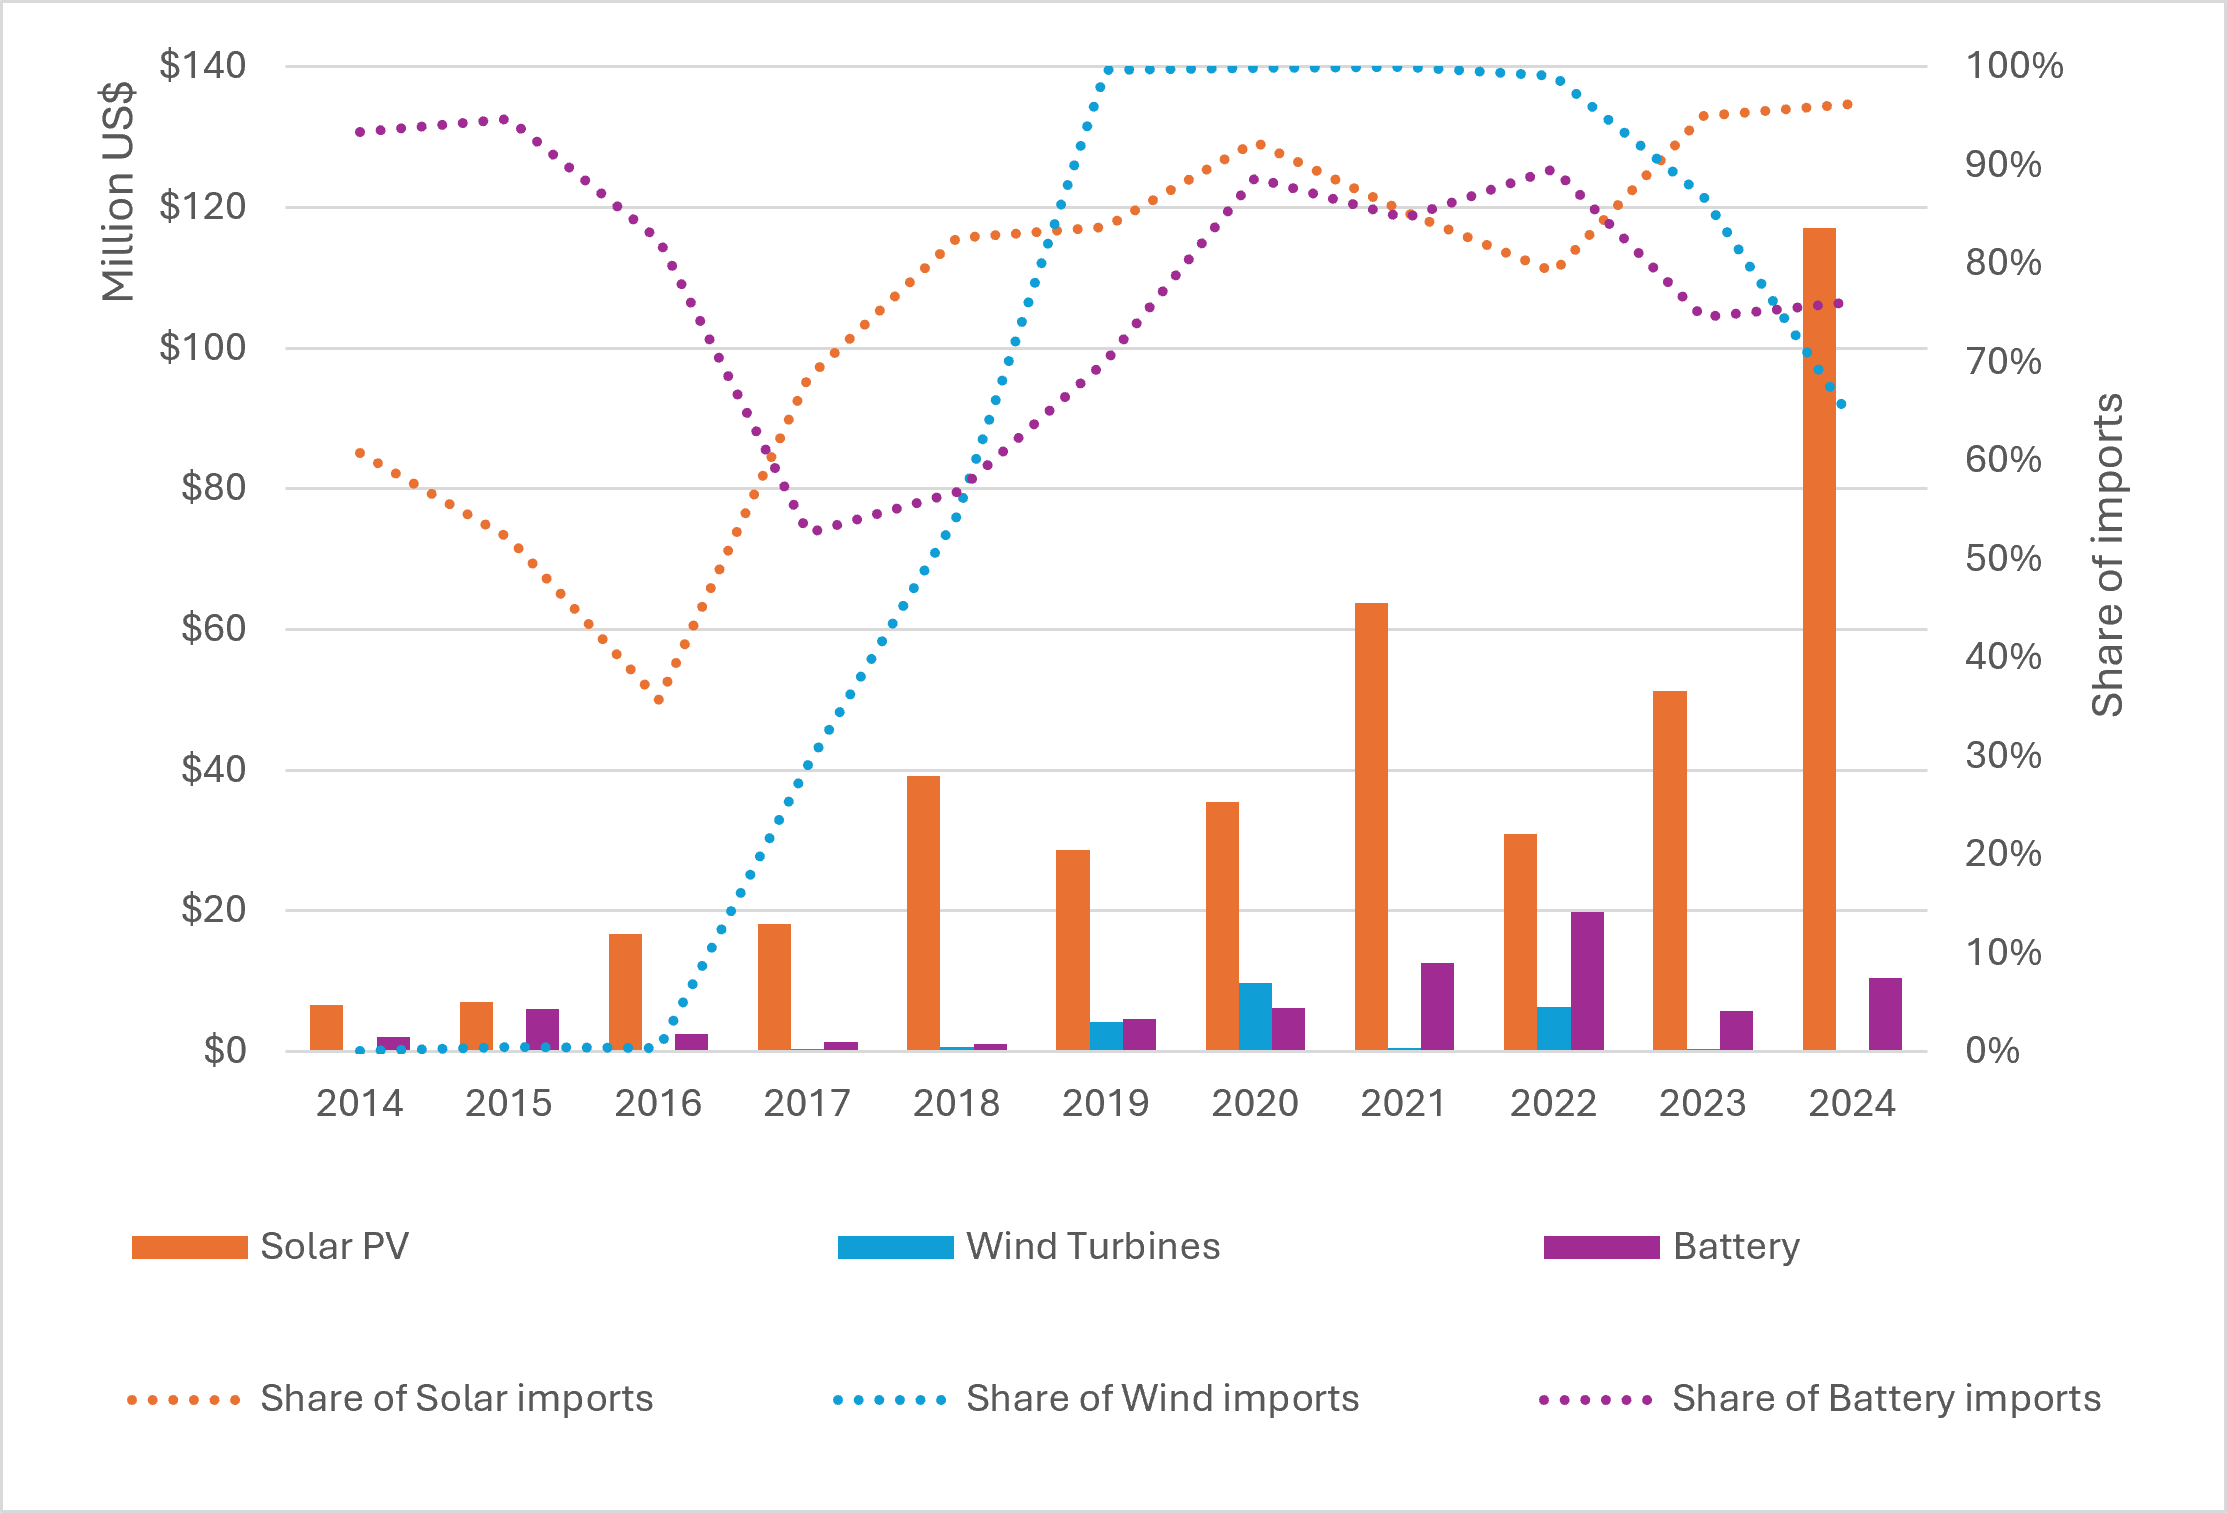
Sri Lanka’s imports of solar PV components from China have steadily increased, both in absolute terms and as a percentage of total imports, reaching US$ 117 million in 2024. Notably, even during the Sri Lankan financial crisis from 2019 to 2024, when both its forex reserves and the value of its currency declined, the country continued to import an average of US$ 50 million worth of components.
As South Asian countries accelerate their clean energy transitions, they are increasingly relying on imports of clean energy (CE) components. Together with the Bangladesh analysis presented in the first blog, the trends in Sri Lanka and Nepal illustrate how CE trade has evolved and what they could mean for India’s regional interests.
Sri Lanka’s Clean Energy Imports
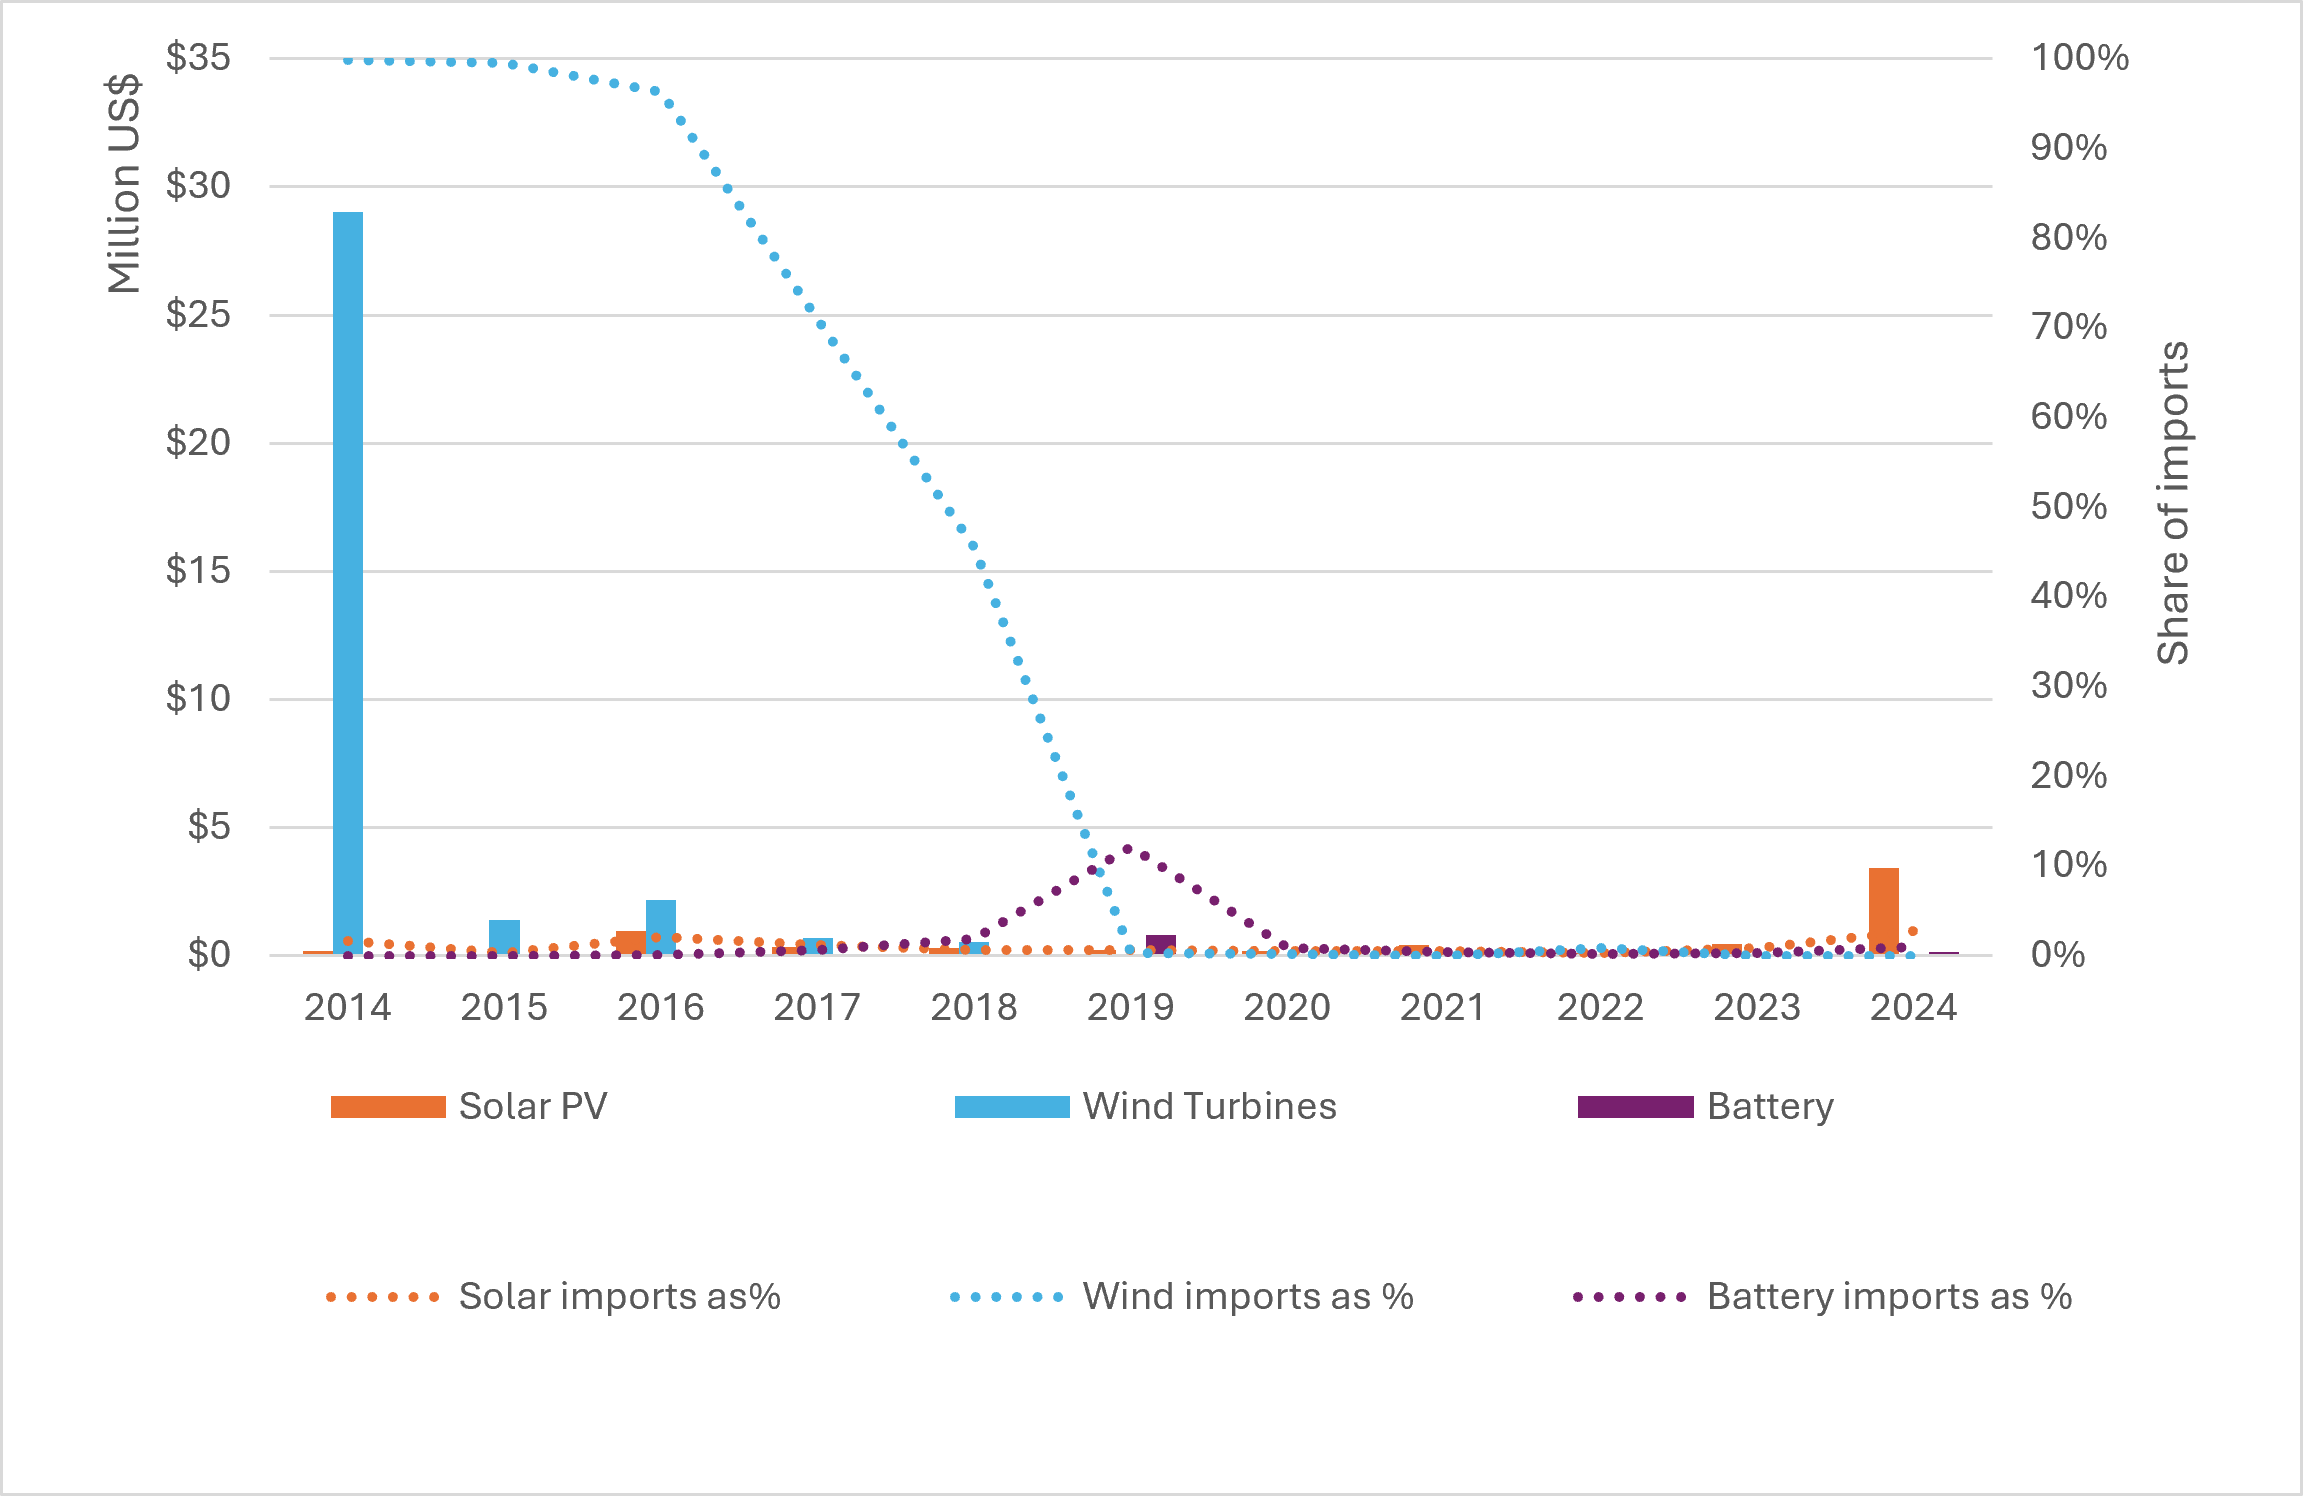
Sri Lanka’s imports of solar PV components from China have steadily increased, both in absolute terms and as a percentage of total imports, reaching US$ 117 million in 2024. Notably, even during the Sri Lankan financial crisis from 2019 to 2024, when both its forex reserves and the value of its currency declined, the country continued to import an average of US$ 50 million worth of components (Figure 1). By contrast, imports from India remained negligible for much of the past decade and have only begun to slowly grow since 2023 (Figure 2).
Figure 1: Sri Lanka’s Imports of Solar PV, Wind Turbine and Battery Components From China
 Source: UN Comtrade Database: Commodity codes 854140, 854142, 854143, 850231, 850760 (Sri Lanka’s imports from China, Hong Kong SAR, and Macao SAR).
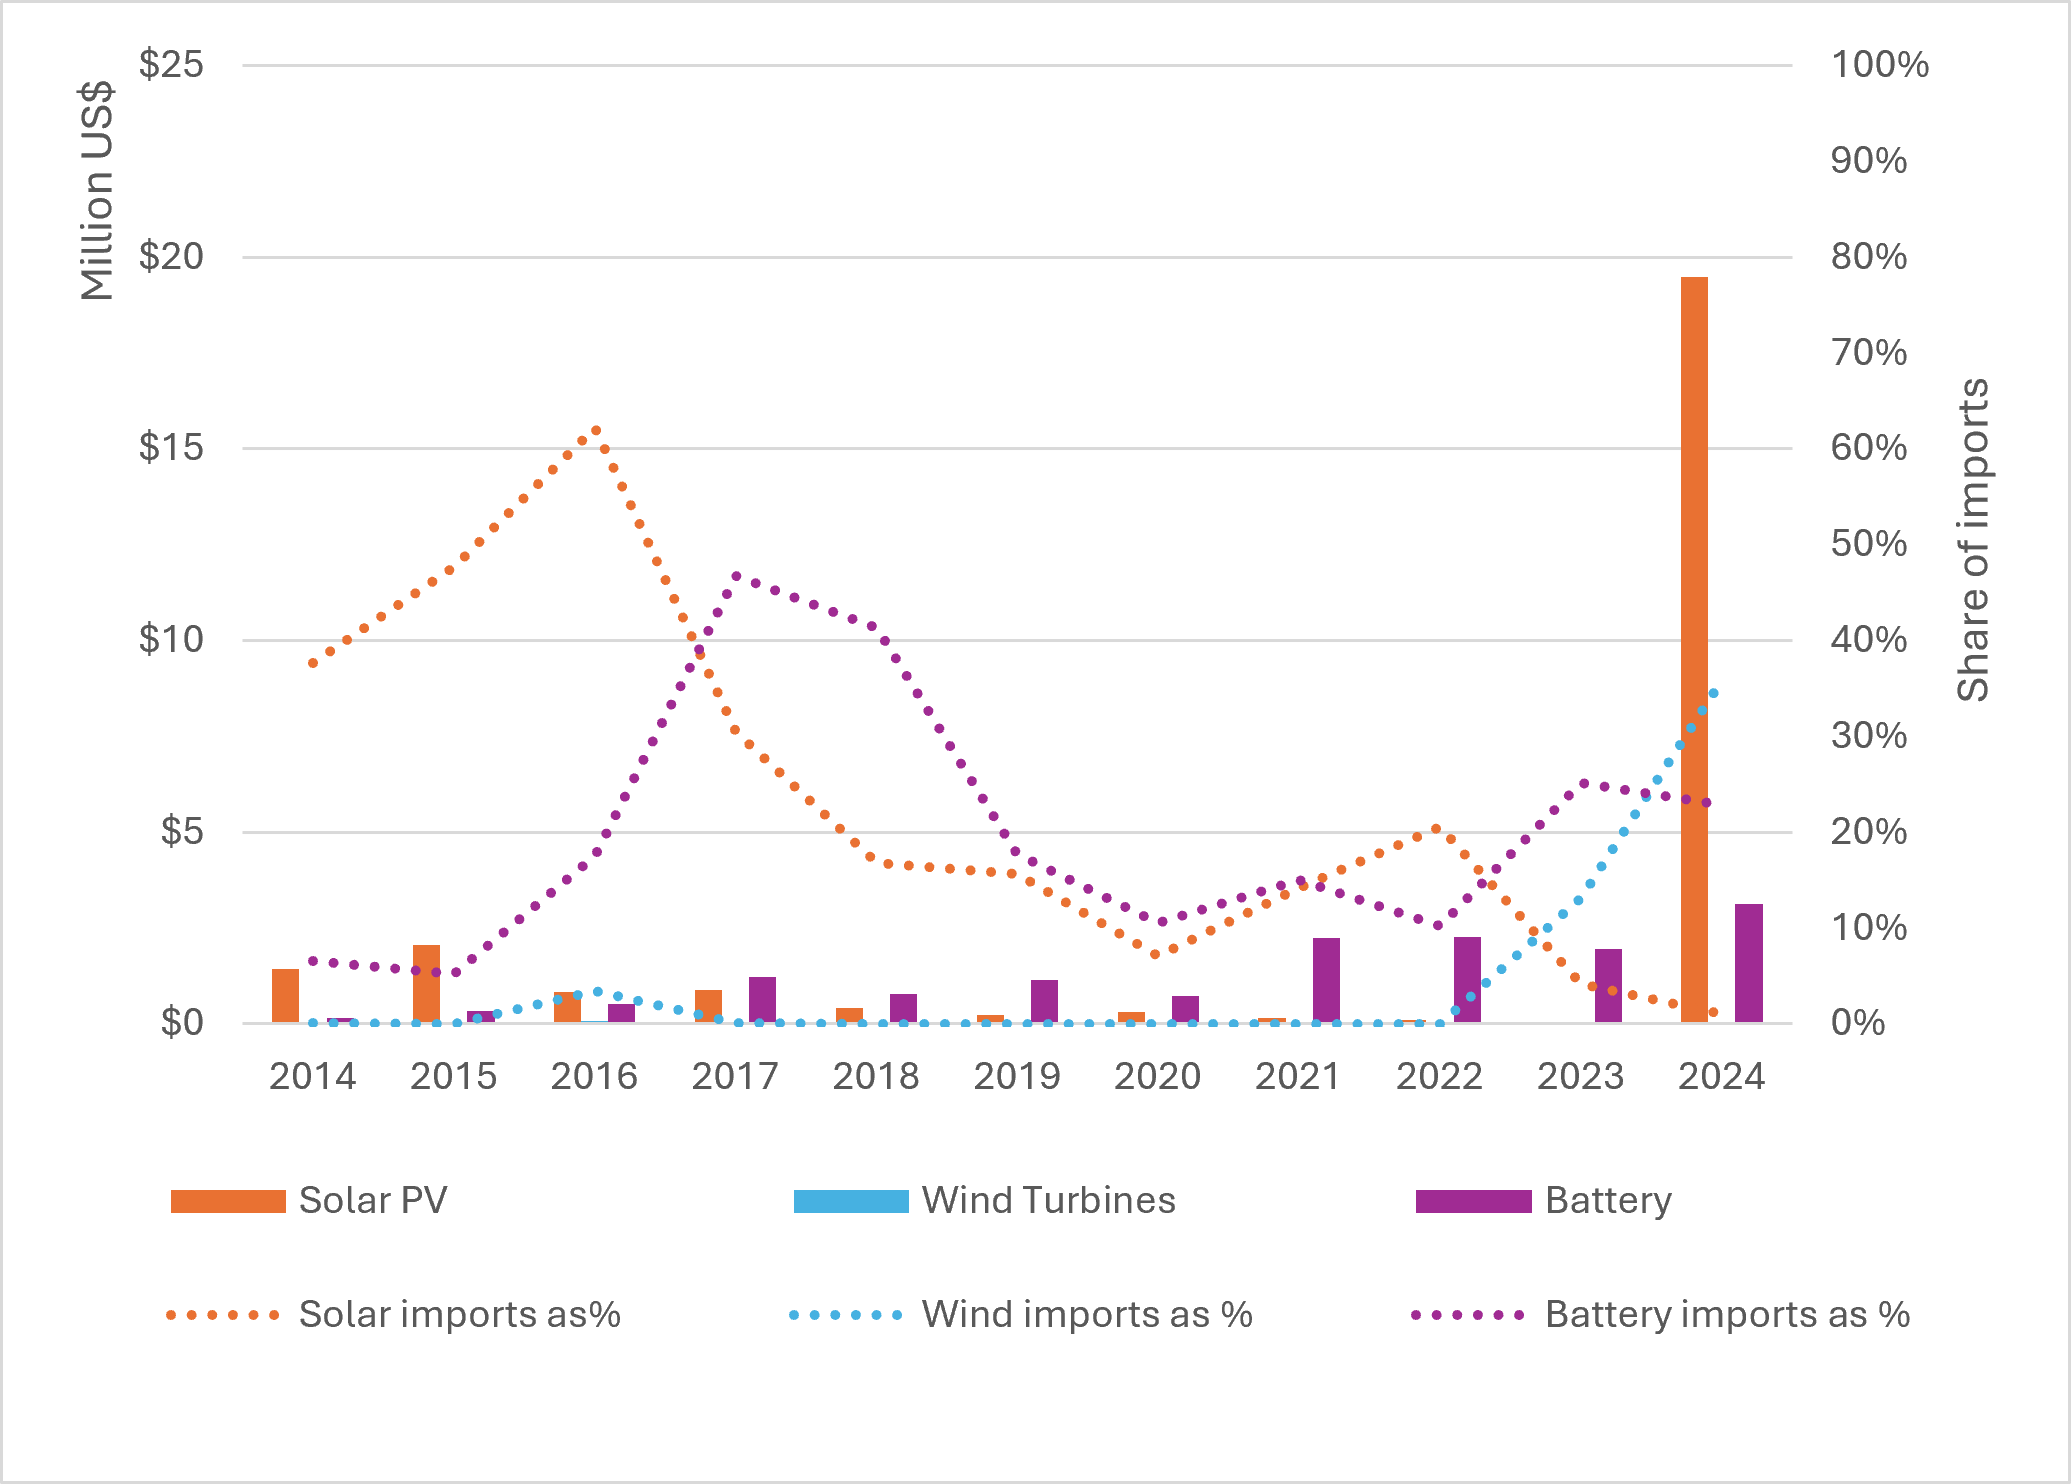
China has also been a major supplier of battery components. However, its share declined between 2017 and 2019, when demand was satisfied through imports from Singapore (2017, 2018), Australia (2017), Japan (2018, 2019), and India (2019) (Figure 3).
Figure 2: Sri Lanka’s Imports of Solar PV, Wind Turbine and Battery Components From India
 Source: UN Comtrade Database: Commodity codes 854140, 854142, 854143, 850231, and 850760.
India was an important supplier of wind turbine components between 2014 and 2018 but has since been largely displaced by China, which has maintained a dominant share since 2019 (Figure 2). The recent decline in China’s share since 2022 has been driven by increased imports from other players such as Spain (2023) and Portugal (2024) Figure 3).
Figure 3: Sri Lanka’s Imports of Solar PV, Wind Turbine and Battery Components, Excluding China and India
 Source: UN Comtrade Database: Commodity codes 854140, 854142, 854143, 850231, and 850760.
Nepal’s Clean Energy Imports
Between 2014 and 2018, Nepal sourced the majority of its solar PV components from India; however, since 2019, these have been gradually replaced by imports from China. Imports of wind turbine components have remained low, never exceeding US$ 20,000 (Figure 4).
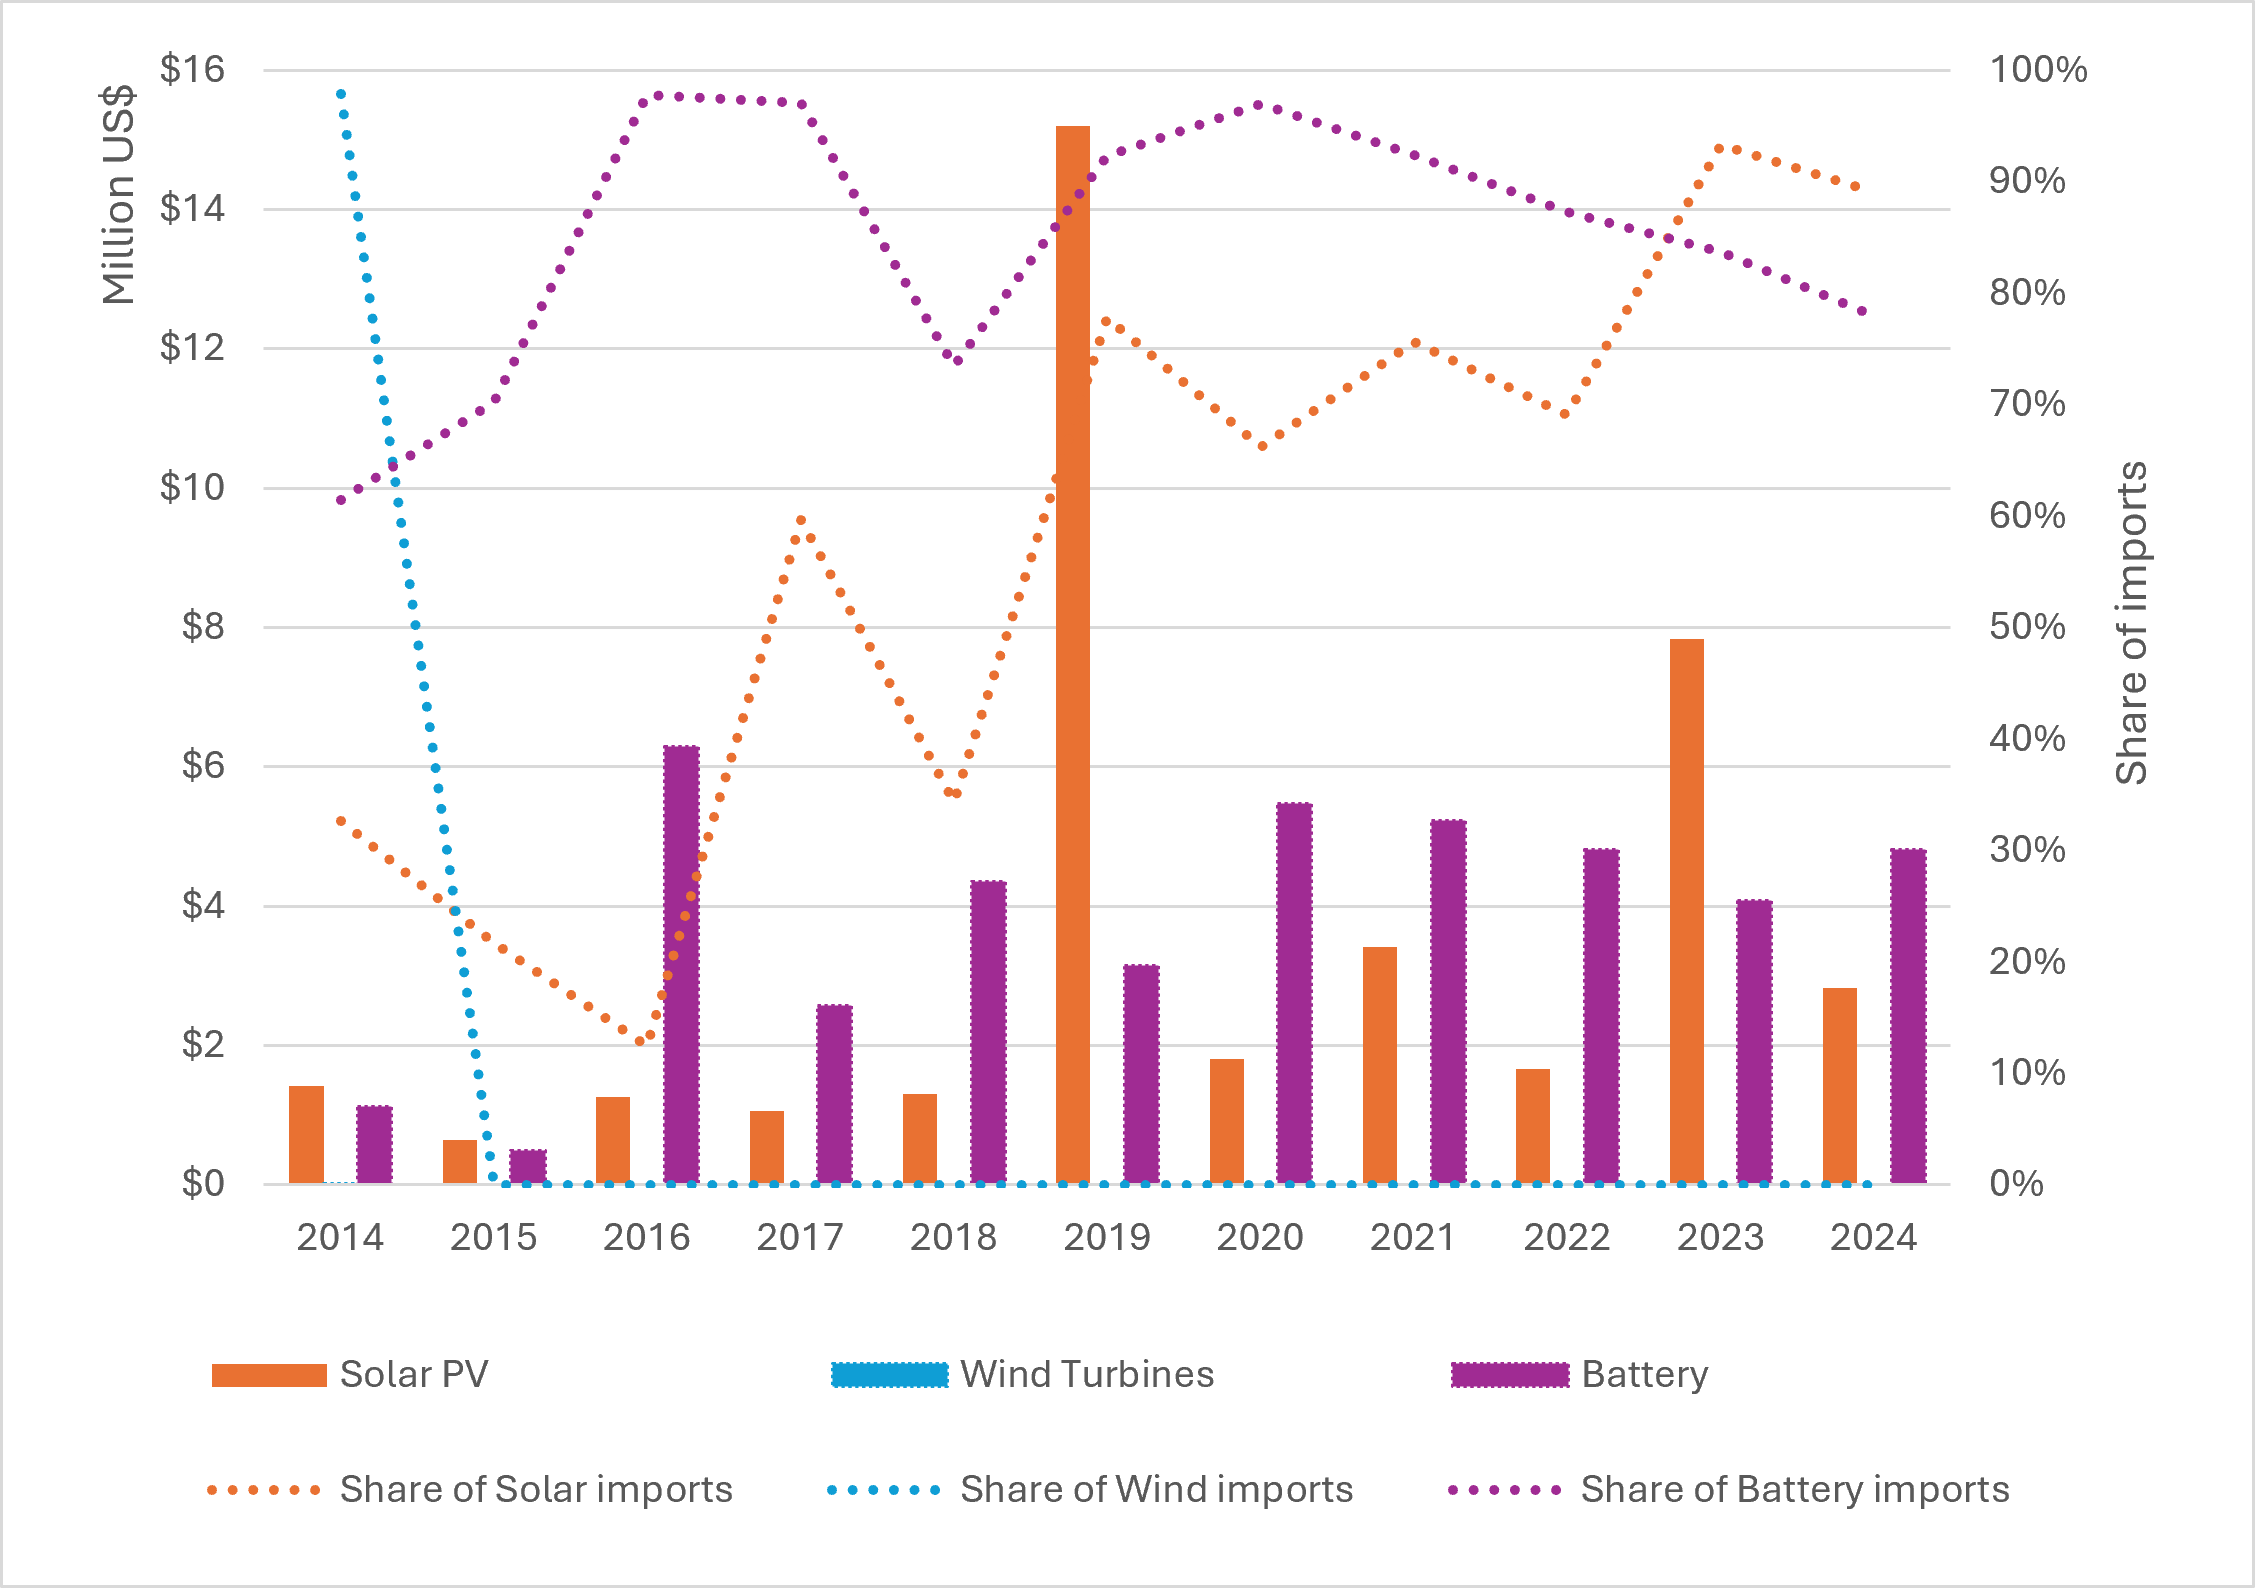 Source: UN Comtrade Database: Commodity codes 854140, 854142, 854143, 850231, and 850760 (Nepal’s imports from China, Hong Kong SAR, and Macau SAR).
Imports of wind turbine components from China stopped in 2015 and were replaced by those from India, which, although small in absolute terms, occasionally accounted for the entirety or a substantial proportion of imports (Figure 4 and Figure 5). Spain was another source of imports during 2015 and 2017, although these never amounted to more than US$ 2,000 (Figure 6).
Figure 5: Nepal’s Imports of Solar PV, Wind Turbine and Battery Components from India
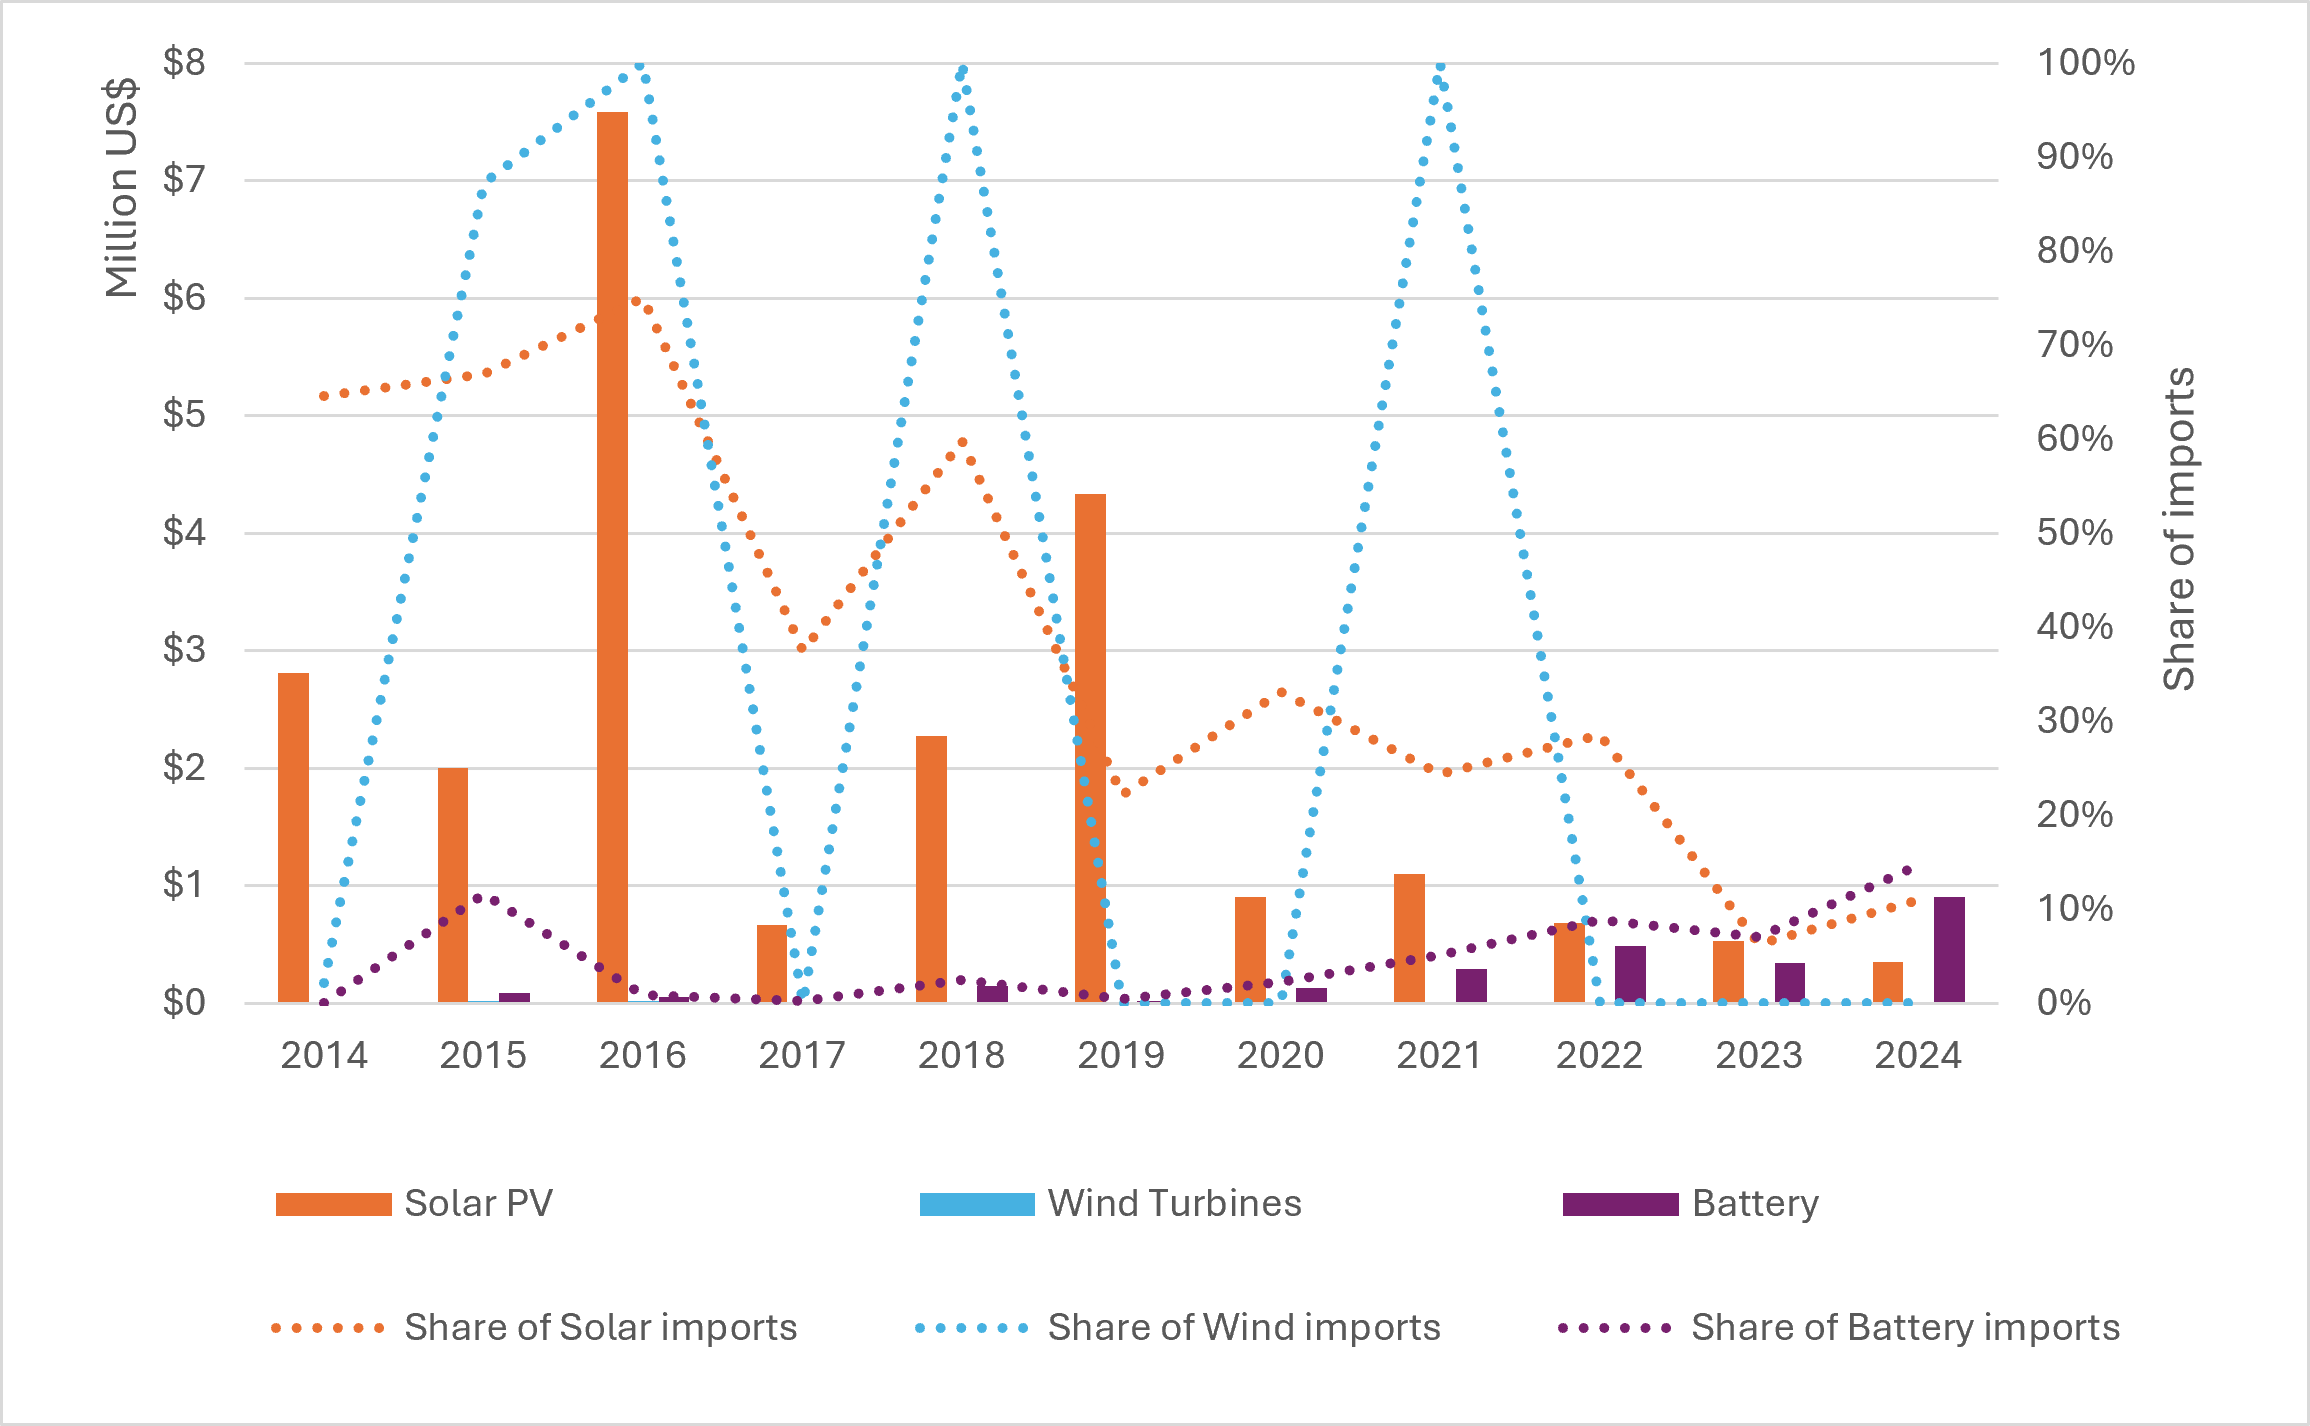 Source: UN Comtrade Database: Commodity codes 854140, 854142, 854143, 850231, and 850760.
Chinese battery component imports have dominated the market since 2014. However, its share has gradually declined since 2020, falling to around 78% by 2024 as imports from South Korea (2023) and India increased (Figure 5 and Figure 6). The dip in the share of Chinese imports in 2018 was supplemented by imports from Japan (Figure 6).
Figure 6: Nepal’s Global Imports of Solar PV, Wind Turbine and Battery Components, Excluding China and India
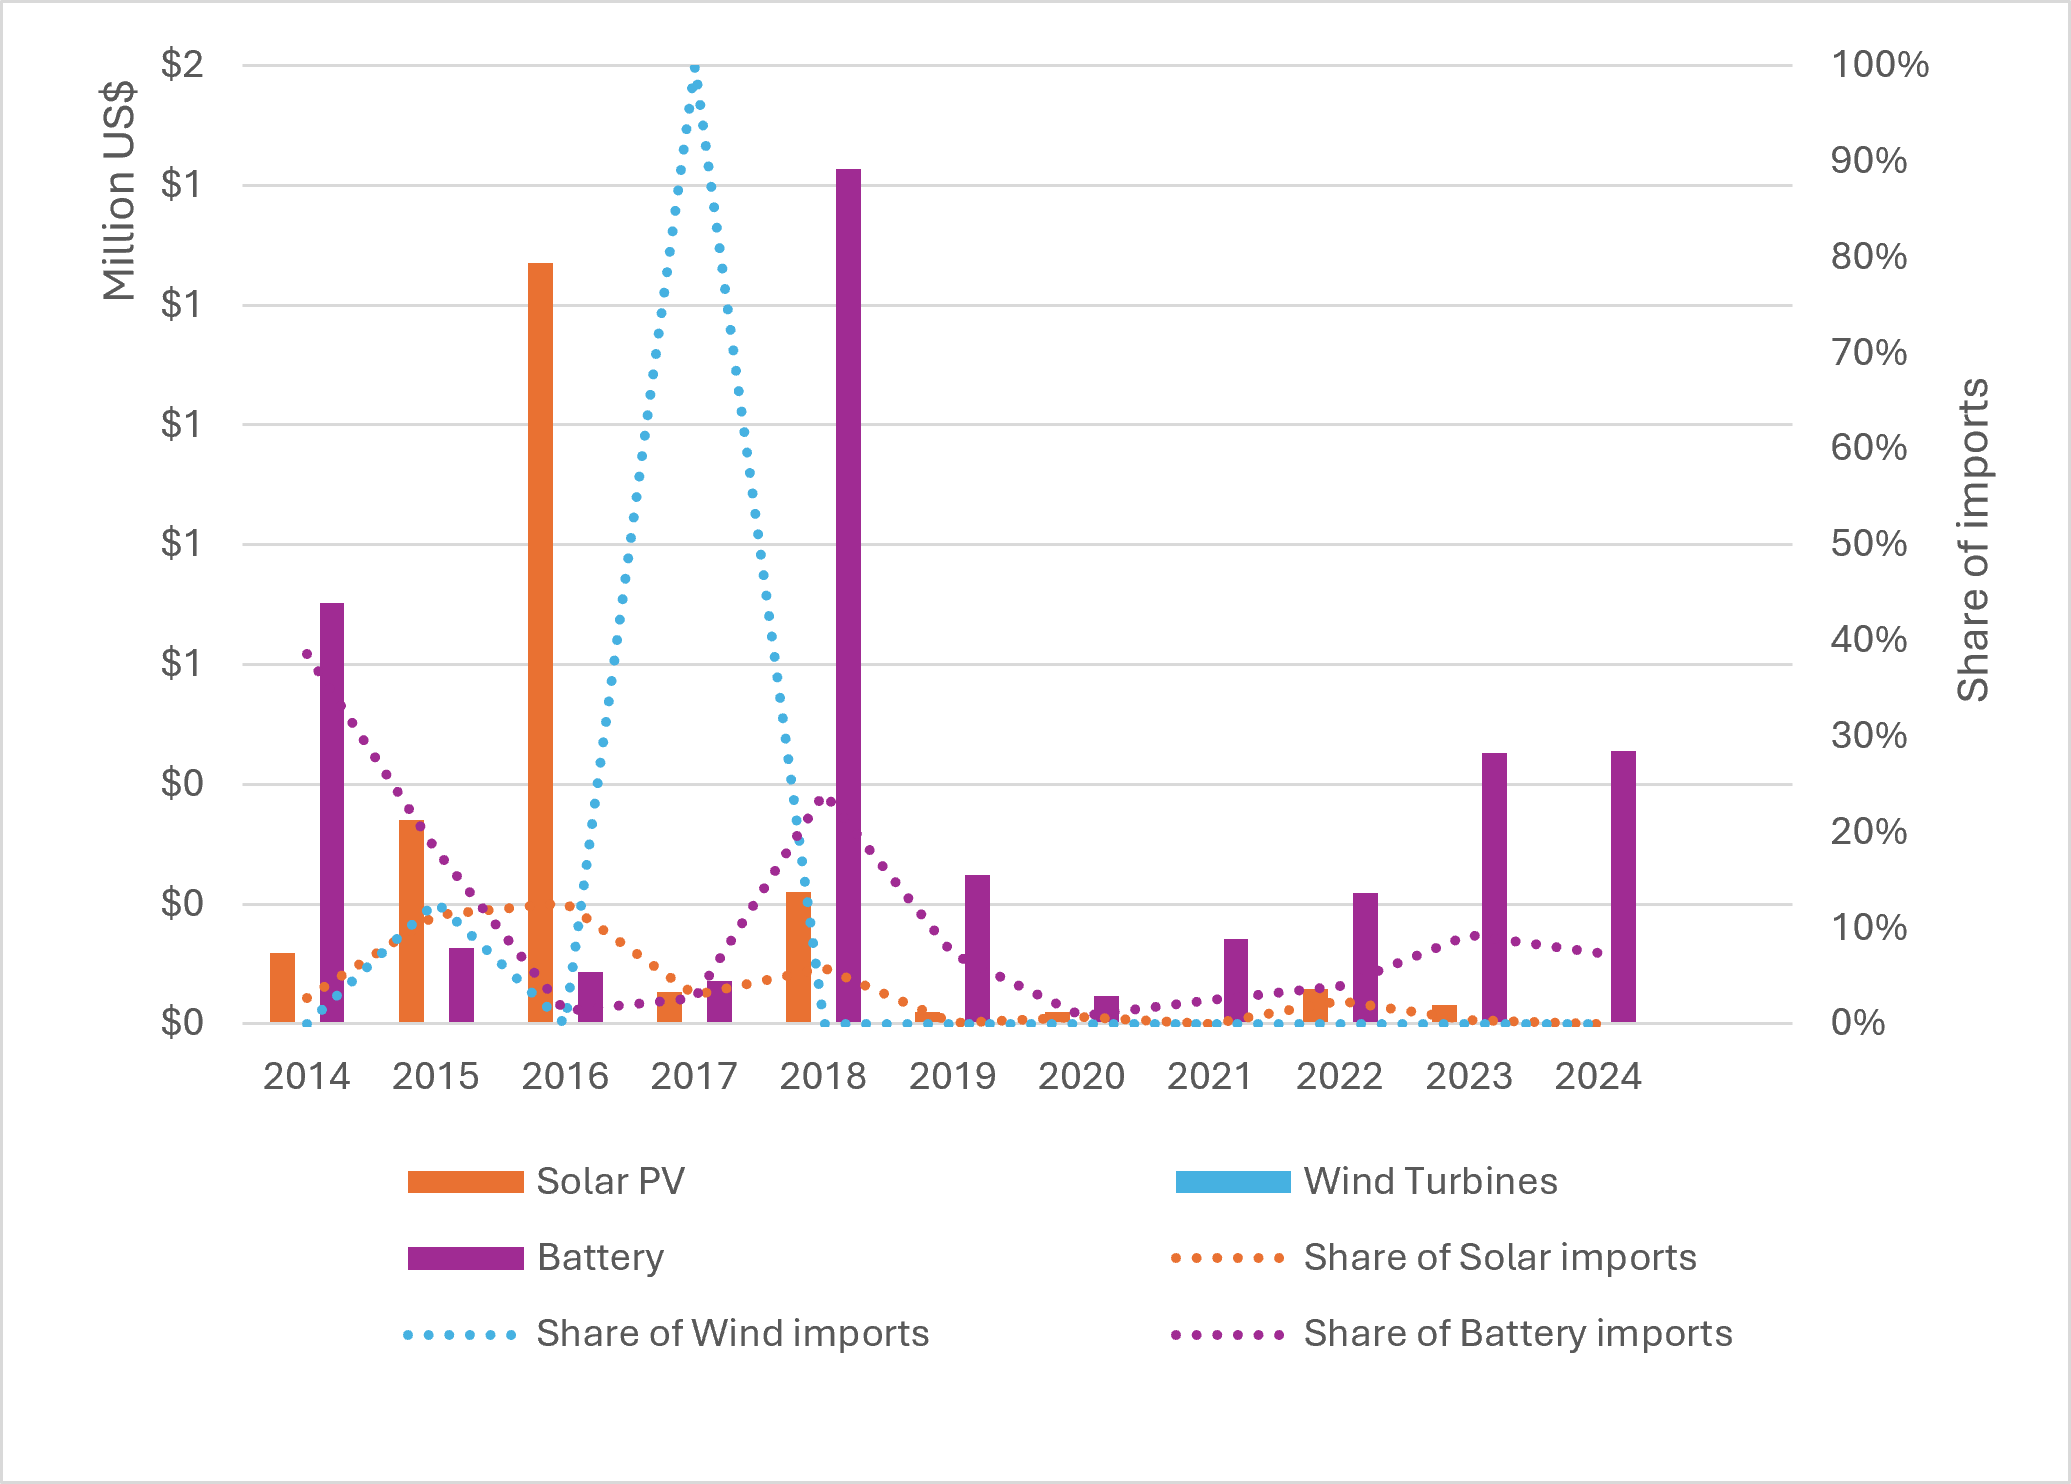 Source: UN Comtrade Database: Commodity codes 854140, 854142, 854143, 850231, and 850760.
The trends observed show that today China is now the dominant player in CE trade in the region. This was not always the case.
Way Forward
The trends observed show that today China is now the dominant player in CE trade in the region. This was not always the case. Between 2014 and 2024, India played an important role in supplying solar PV components to Nepal and wind turbine components to Sri Lanka. China’s rise to dominance was driven by export-oriented policies such as the Belt and Road Initiative International Green Development Coalition (BRIGC) and the Global Development Initiative. In 2021, these efforts were supplemented by President Xi Jinping’s pledge to fund renewable energy projects instead of coal power plants abroad.
As the energy transition in South Asia becomes increasingly dependent on China, imports will translate into after-sales services, industrial linkages, and increased cooperation on technological standards and financing. Indian manufacturers will find a narrower window for regional exports, and policymakers will consequently find it harder to leverage India’s geographic proximity and trade ties for sustained economic presence.
This is reflective of China’s early focus on CE manufacturing built on strong state support, targeted financial incentives, and the green stimulus introduced following the 2008 financial crisis. These measures resulted in consequent economies of scale and lower production costs. India, by contrast, was unable to develop an equally competitive CE manufacturing ecosystem during the same period. Inadequate and inconsistent incentives, weak policy enforcement, land acquisition challenges, limited industry networks, restricted access to affordable credit, and low demand aggregation are some of the reasons for this lack of competitiveness.
However, today India is gradually strengthening its green manufacturing base. Its recent gains in these markets may be indicative of both improvements in domestic capabilities and a growing desire of South Asian countries to diversify their supply chains, as evidenced by imports from third countries like Spain, Portugal, Japan, South Korea, and Australia.
Nevertheless, countering China’s dominance will be difficult. As the energy transition in South Asia becomes increasingly dependent on China, imports will translate into after-sales services, industrial linkages, and increased cooperation on technological standards and financing. Indian manufacturers will find a narrower window for regional exports, and policymakers will consequently find it harder to leverage India’s geographic proximity and trade ties for sustained economic presence.
To address this, policymakers could explore measures to increase India’s presence in the neighbourhood. Some potential approaches to incentivise the private sector to develop export competitiveness include developing an export-specific CE policy, cooperation on technical standards, preferential trade agreements, and encouraging CE financing in export countries. Future research could examine the feasibility of these and other policy options. In the meantime, India must also continue to strengthen its CE export ecosystem by identifying and building on its comparative advantages, fostering innovation, and achieving greater economies of scale.
The author would like to thank Pooja Ramamurthi, Constantino Xavier, Jabin T. Jacob, Rahul Tongia, and Prerna Prabhakar for their valuable feedback and insightful suggestions, which informed the analysis presented in this blog.



Find on this page

The Centre for Social and Economic Progress (CSEP) is an independent, public policy think tank with a mandate to conduct research and analysis on critical issues facing India and the world and help shape policies that advance sustainable growth and development.