
Floods, Fiscal Stress, and Green Budgeting in Assam
Reading Time: 5 minutesEditor's Note
This analysis examines how climate-related disasters, particularly floods, affect Assam’s public finances and the role of green budgeting in strengthening fiscal preparedness. While natural disasters also include geophysical hazards like earthquakes, this analysis focuses strictly on climate-related events—hydrological, meteorological, and climatological—as classified in the EM-DAT database. Disaster events are reported by calendar year, while fiscal variables follow the April–March financial year.
While policy discourse often focuses on the immediate physical and human toll—lost lives, damaged infrastructure, and displaced communities—an equally critical challenge is the strain on public finances.
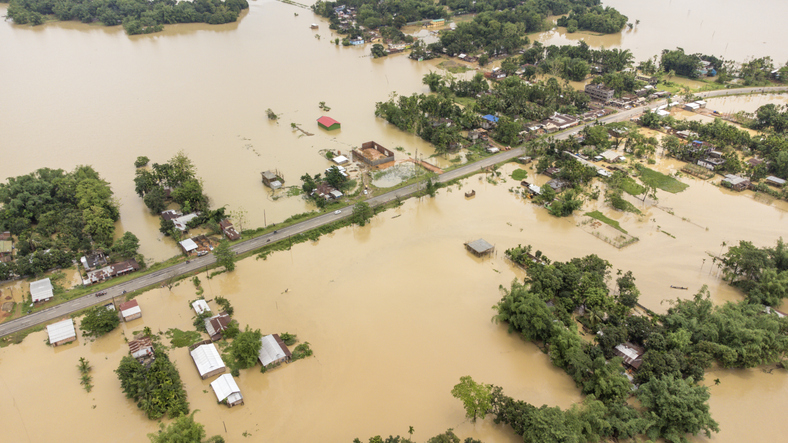
Assam’s topography, shaped by the volatile Brahmaputra and Barak river basins, low-lying floodplains, Himalayan runoff, and intense monsoons, makes the state particularly prone to floods and other natural disasters. As climate change accelerates, the risks associated with these hazards are intensifying, making Assam one of India’s most climate-vulnerable states.
How states account for climate spending therefore matters.
While policy discourse often focuses on the immediate physical and human toll—lost lives, damaged infrastructure, and displaced communities—an equally critical challenge is the strain on public finances. Although the state maintains baseline budgetary provisions for disaster response, severe climate emergencies frequently exceed these provisions, constraining overall fiscal space.
Can the state’s fiscal response mechanism absorb the economic damage caused by these disasters?
How states account for climate spending therefore matters. Adaptation expenditure in most Indian states is scattered across departmental budgets and is difficult to distinguish from routine spending. Without formal tagging, policymakers cannot establish baselines, identify gaps, or assess whether resources match exposure. They also cannot determine how much fiscal pressure is avoidable. Assam’s Green Budget is an attempt to close that gap.
The Evolution of Climate Events
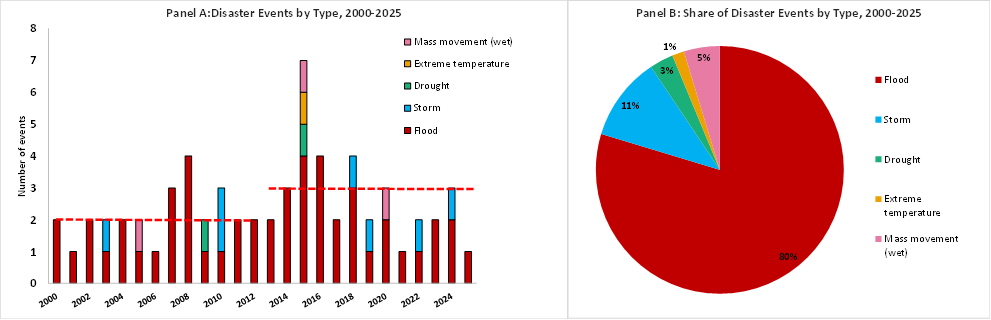
Between 2000 and 2025, Assam recorded 64 weather-related disasters. Floods accounted for 80% (51 events), followed by storms at 11%; droughts, extreme temperatures, and wet mass movements made up the remainder (Figure 1). Hazard frequency has risen steadily; a split-sample comparison shows that the average number of disaster events increased from two per year (2000–2012) to three (2013–2025). Annual volatility also varied, peaking at seven events in 2015, when floods coincided with drought, extreme heat, and mass movements.
Figure 1: Climate-Related Disaster Events in Assam
Source: EM-DAT database; authors’ calculations.
The Relief Coverage Gap
This raises a critical question: Can the state’s fiscal response mechanism absorb the economic damage caused by these disasters?
By isolating Assam-specific damage costs from the EM-DAT database,[1] and comparing them with the state’s spending on emergency assistance under Relief on Account of Natural Calamity (which covers immediate relief, rescue and rehabilitation), we calculated a ‘coverage ratio’ measuring the share of losses covered by state relief funds.
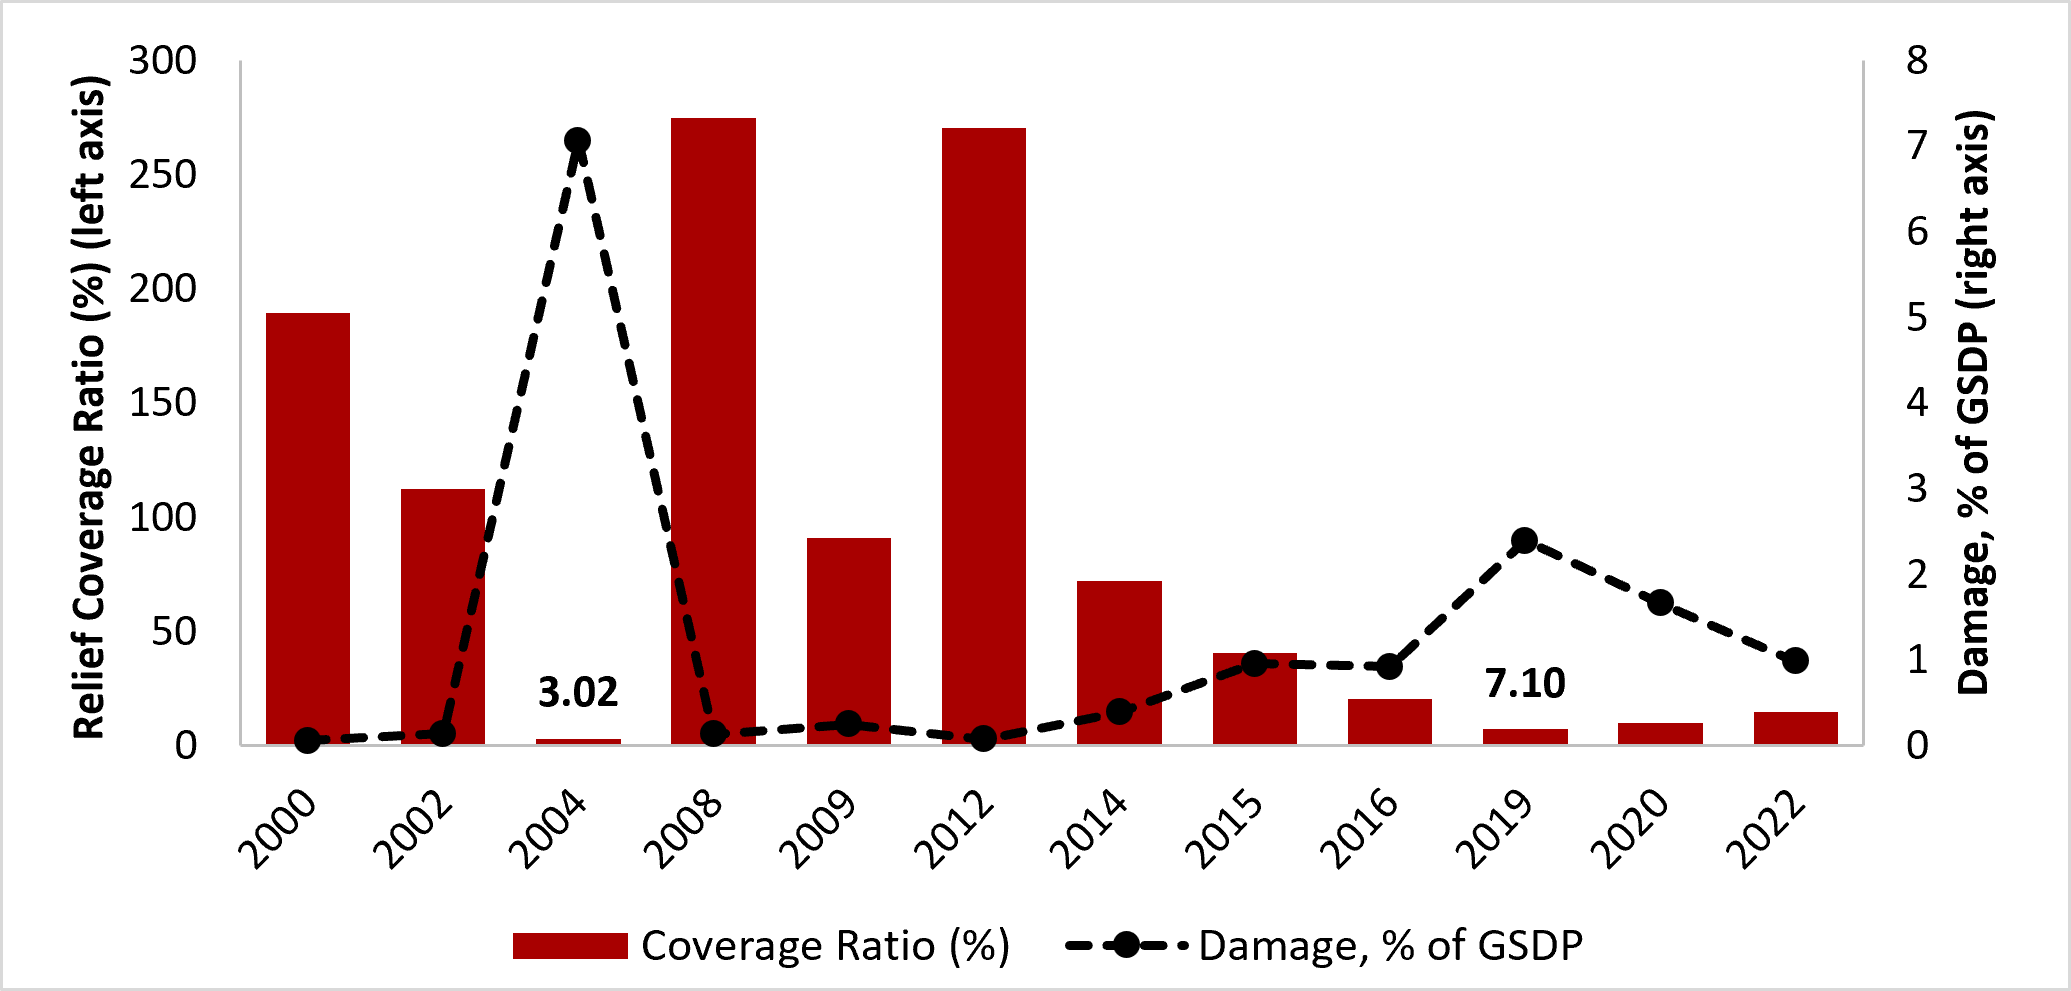
In milder disaster years (such as 2000, 2008, and 2012), when total damages remained under 0.15% of GSDP, relief provisions yielded coverage ratios of well over 100%. However, during severe disaster events, coverage collapsed. In 2004, when damages reached 7.06% of GSDP, state relief covered a mere 3.02% of the cost. In 2019, damages equalled 2.39% of GSDP, with relief covering only 7.10% of the total cost. Even in 2020 and 2022, state relief covered less than 15% of the total monetary losses (Figure 2). Since 2014, the coverage ratio has averaged roughly 27% of total damages.
Figure 2: The Relief Coverage Gap: Coverage Ratio vs Disaster Severity
Source: EM-DAT database; RBI State Finances; India Stat; authors’ calculations.
It is important to note that this statutory relief is designed for short-term support like food rations, temporary shelters, and rescue operations. It is not built to fund large-scale reconstruction of washed-away roads, breached embankments, or private assets. Thus, during catastrophic floods, around 80–90% of the total economic damage can fall outside the scope of immediate statutory relief, requiring longer-term fiscal absorption.
While this exercise does not imply a strict one-to-one causal relationship, given the multiple macroeconomic factors shaping state budgets, a general fiscal co-movement across disaster categories is evident.
Fiscal Co-Movement Across Disaster Tiers
To examine the wider fiscal context, we categorised fiscal years into four disaster tiers: < 3 events per year, elevated shock years (>= 3 events), severe disaster years (>= 4 events), and extreme calamity years (7 events). Tracking specific variables across these tiers shows how fiscal dynamics vary with disaster severity.
By mapping these scheme-level outlays across departments, Assam is building the fiscal baseline most Indian states still lack.
While this exercise does not imply a strict one-to-one causal relationship, given the multiple macroeconomic factors shaping state budgets, a general fiscal co-movement across disaster categories is evident (Table 1).
- < 3 events per year: In the 17 relatively calm years, averaging 1.8 disasters annually, Central Grants grew at 14.7% and made up 32.71% of total revenue. Internal debt grew by 38.66%, while calamity relief accounted for 1.48% of revenue expenditure.
- >= 3 events: Across 9 years, averaging 3.8 disasters, debt growth climbed to 59.19%, while the calamity relief burden expanded to 1.60% of revenue expenditure.
- >= 4 events: In these four years, averaging 4.8 disasters, Central Grants growth accelerated to 18.71%, internal debt grew at 139.66%, and the relief burden jumped to 1.82% of total revenue expenditure.
- 7 events: In the peak year, Central Grants surged by 57.02% (reaching 36.76% of total revenue), relief spending peaked at 1.94% of revenue expenditure, and internal debt grew by 431.24%.
Table 1: Fiscal Co-Movement Across Disaster Tiers: Grants, Relief & Debt

Source: EM-DAT database; RBI State Finances; authors’ calculations
Budgeting For Adaptation
Absorbing these shocks sustainably requires shifting from emergency bailouts to planned adaptation financing across vulnerable sectors. Several Indian states are already spending on resilience, but unclear mapping of these outlays obscures the scale of that commitment. By mapping adaptation expenditure across departments, Assam’s Green Budget makes previously fragmented allocations more visible (Table 2).
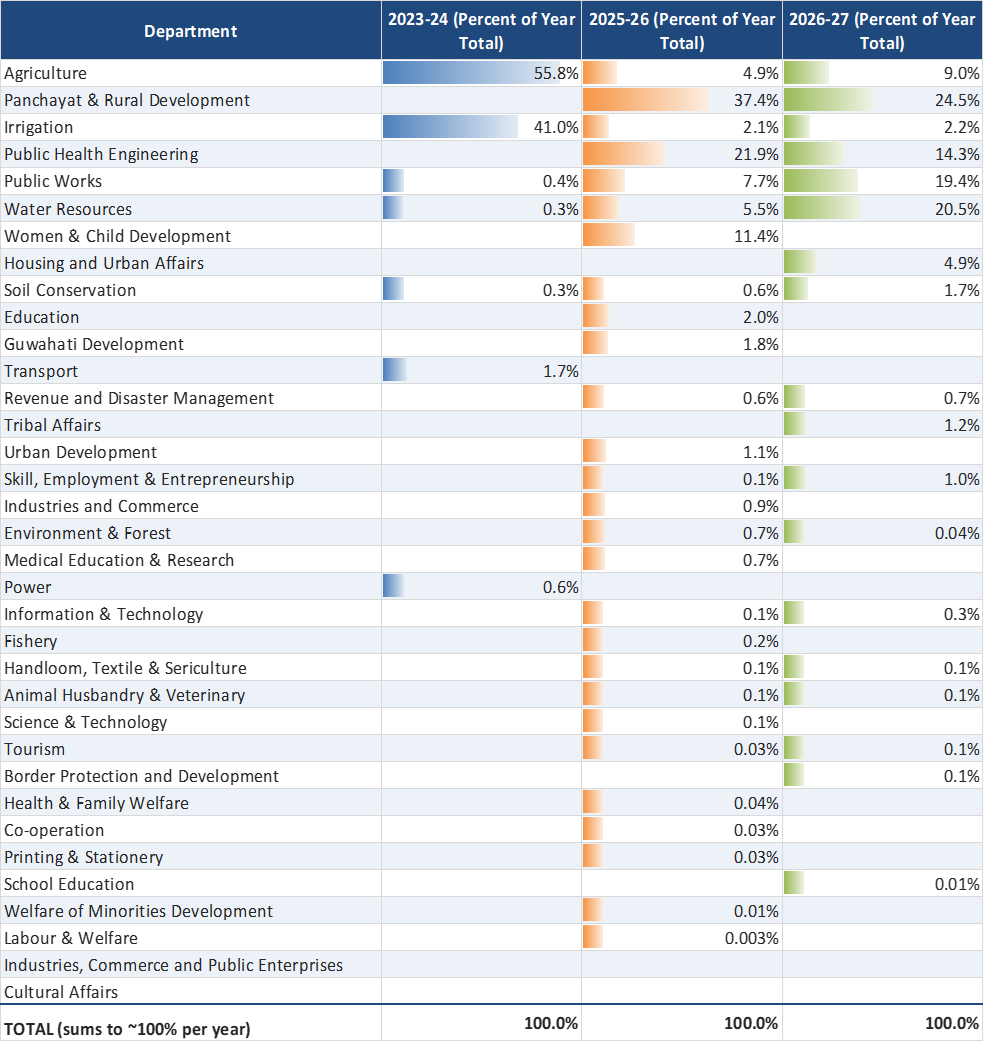
- 2023–2024: The adaptation budget was concentrated in seven departments, totalling ₹817.24 crore. This represented just 0.87% of revenue expenditure, directed almost exclusively to Agriculture (56%) and Irrigation (41%).
- 2025–2026: A major mainstreaming initiative expanded coverage to 27 active departments, scaling the adaptation budget to ₹17,361.69 crore (14.81% of revenue expenditure).
- 2026–2027: The framework was streamlined across 19 departments with an outlay of ₹5,516.15 crore. Rather than being confined to agriculture, allocations now reflect a multi-sectoral strategy. Panchayat & Rural Development leads at 24.5% (including ₹1,350.91 crore for rural housing under PMAY-G), followed by Water Resources at 20.5% (funding riverbank erosion and flood risk management projects), Public Works at 19.4%, Public Health Engineering at 14.3%, and Agriculture at 9%[2].
Table 2: Climate Adaptation Budget by Department, Share of Year Total, 2023–2024 to 2026–2027
Source: Assam’s Green Budget; authors’ calculations
By mapping these scheme-level outlays across departments, Assam is building the fiscal baseline most Indian states still lack. This accounting is pivotal for planning. When emergency relief and central assistance fall short during catastrophic floods, the state may be forced to borrow simply to rebuild what was lost. Making adaptation spending visible helps Assam plan for climate risks in advance rather than respond only after disasters occur. This can reduce the fiscal pressures associated with repeated reconstruction and strengthen the state’s capacity to manage future climate shocks.

Kritima Bhapta



Find on this page

The Centre for Social and Economic Progress (CSEP) is an independent, public policy think tank with a mandate to conduct research and analysis on critical issues facing India and the world and help shape policies that advance sustainable growth and development.