Minerals royalty rates in India: Comparison with other countries
Reading Time: 14 minutes1. Introduction
DOWNLOADS
The mining royalty rates in India are among the highest in the world. There is a need to reduce the rates to facilitate investment and development in the mining sector. Lower royalty rates would encourage future exploration and production of minerals in India. Royalty rates need to be aligned with the international best practices for ensuring competitiveness. Western Australia could be a role model. India should consider profit-based royalty rates which would allow the government to share the benefits of higher commodity prices. A hybrid system may be worked out with the government setting a minimum percentage/ amount that has to be paid. For example, Queensland uses a hybrid approach for bauxite royalties, 75% of the profits or 1.5 AUD per tonne (whichever is higher). The process for reviewing the mineral royalties is slow and time-consuming. The Study Group for the revision of royalty rates was constituted in February 2018 and submitted its report in July 2019. In January 2020, another 11-member panel was set up to examine the issues raised by the stakeholders. The rates haven’t yet been revised.
The mineral royalty rates are specified in the Second Schedule of the Mines and Minerals (Development and Regulation) Act (MMDR), 1957, which was enacted post-independence to regulate and develop the mining sector in India. This discussion note takes a view of the various systems of mineral royalty and their implementation for different minerals in India over time, followed by a comparison with the systems implemented in other developing and developed nations.
Mineral royalty is the economic rent due to the sovereign owner (government) in exchange for the right to extract the mineral substance.
There are three types of royalty taxes –
- Specific or unit-based royalty on a tonnage basis is mostly applied to high volume, low-value homogenous minerals. It is easy to administer and guarantees a continuous revenue flow to the government.
- Profit-based royalty assessment methods tend to be detailed, reflecting all revenues and costs, including capital and recurring operating costs, and arriving at the resulting profits to miners.
- Ad valorem royalty (value-based) is output-based royalty that is levied as a percentage of the value of production of minerals in a mining project.
Chakraborty et al. (2016) show that tonnage-based royalty rates are much lower than other regimes as costs of “mining, smelting, milling and refining do not affect the royalty base” and thus, reduce the risk to the government revenues. Profit-based royalty rates, on the other hand, are much higher as the “royalty base” is more volatile. Ad valorem royalty rates fall between tonnage-based and profit-based royalty rates.
2. Royalty rates system in India
2.1. Royalty Study Group
India has one of the highest royalty-rates regimes in the world (Chakraborty, 2014). Currently, India follows a combination of tonnage-based and ad valorem royalty rates. Every three years, the Government of India sets up a Royalty Study Group to suggest revisions in the royalty rates across minerals. The royalty rates cannot be revised more than once every three years as specified in Section 9 of the MMDR Act. Generally, there is an upward revision of the royalty rates of minerals by this study group. The last revision was published with the 2015 amendments to the MMDR Act. The Study Group recommended upward revisions of 21 major minerals including bauxite, copper, iron ore, lead, limestone, and zinc.
In February 2018, the Ministry of Mines had set up a Study Group for the revision of royalty rates. This Study Group had submitted its report in July 2019 for review and comments from the stakeholders. But royalty rates have not been finalised yet. In January 2020, another 11-member panel had been set up to examine the issues raised by the stakeholders.
2.2. Historical movement of royalty rates
Till 1966, the royalty rates for 21 minerals were based on the unit of production (tonnage basis) but were subject to a cap of 20% of their ad valorem value (Indian Bureau of Mines, 2011). The remaining mineral royalties were based on the ad valorem system. Therefore, all the minerals were linked, directly or indirectly, to the value of minerals (ad valorem).
The Government of India set up the first Study Group in 1966 before which the royalty rates were modified when deemed necessary for different minerals at different rates. The Study Group was set up to undertake a comprehensive review of the royalty rates on all minerals, keeping in view the impact of royalty on production, exports, and the inflow to the state revenues by mineral-based industries.
Additionally, under various state acts, the state governments imposed individual cesses on mineral production, which were linked to the royalties. In 1990, the Supreme Court passed a judgement to remove these individual cesses (Indian Bureau of Mines, 2011). As a response to that, the central government increased the royalty rates to accommodate and protect the state revenues. Consequently, there was a sharp increase in royalty rates in 1992.
In 1997, the Study Group published a revision of the royalty rates. The revision reflected the policy of liberalisation to make the royalty rates comparable with international rates by extending the scope of the ad valorem system to 19 minerals. The Study Group aimed to increase state revenues, and make the rapid development of the mining industry and “a complete switch over to ad valorem rates” possible (Indian Bureau of Mines, 2011).
The royalty rate regime has not yet achieved the “complete switch over” but has broadly moved away from tonnage royalty regime to ad valorem royalty regime. The tonnage-based royalty rates were reduced from nine minerals in 2011 to seven minerals in 2015.
2.3. Calculation of royalty rates
The royalty on an ad valorem basis is calculated as follows (Indian Bureau of Mines, 2011) –
Royalty = Sale price of mineral (grade-wise and state-wise) published by the Indian Bureau of Mines (IBM) X rate of royalty (in percentage) X total quantity of mineral grade produced/dispatched
The royalty on metallic minerals like copper, zinc, lead, bauxite, etc. is based on the price movements of the London Metal Exchange (LME). The royalty to be paid based on the London Metal Exchange (LME) or London Bullion Market Association price is calculated as follows:
Royalty = rate of royalty (in percentage) X sale price of the metal for the month published by IBM X total quantity of metal contained in ore/total by-product metal produced
The royalty on a tonnage basis is calculated as follows –
Royalty = quantity of mineral removed/ dispatched X specified rate of royalty (in rupees)
2.3.1. Average sale price
According to the Mineral (other than atomic and hydrocarbons energy minerals) Concession Rules (2016), at the time of the removal or consumption of the mineral from the lease area, the royalty is calculated based on the latest available average sale price of the said mineral grade and the same is paid to state governments as a provisional payment. Once the IBM publishes the average sale price of the mineral for the month, adjustments of the actual amount payable can be made towards the provisional amount paid.
The computation of the Average Sale Price is done using the ex-mine price as specified under section 42 of the Mineral Concession Rules. The ex-mine price of a mineral grade or concentrate for exported minerals is the free-on-board (F.O.B) price of the mineral minus the actual expenditure incurred beyond the mining lease area, divided by the total quantity exported, whereas the ex-mine price for domestic sales is the sale value of the mineral minus the actual expenditure incurred, divided by the quantity sold. If no sale has occurred, the average sale price published monthly by IBM is used. If the information for a state is not published by IBM, the last available price published in the last six months is used. If that is also not available, then the latest All India price published by IBM is to be used.
3. Global royalty rate system
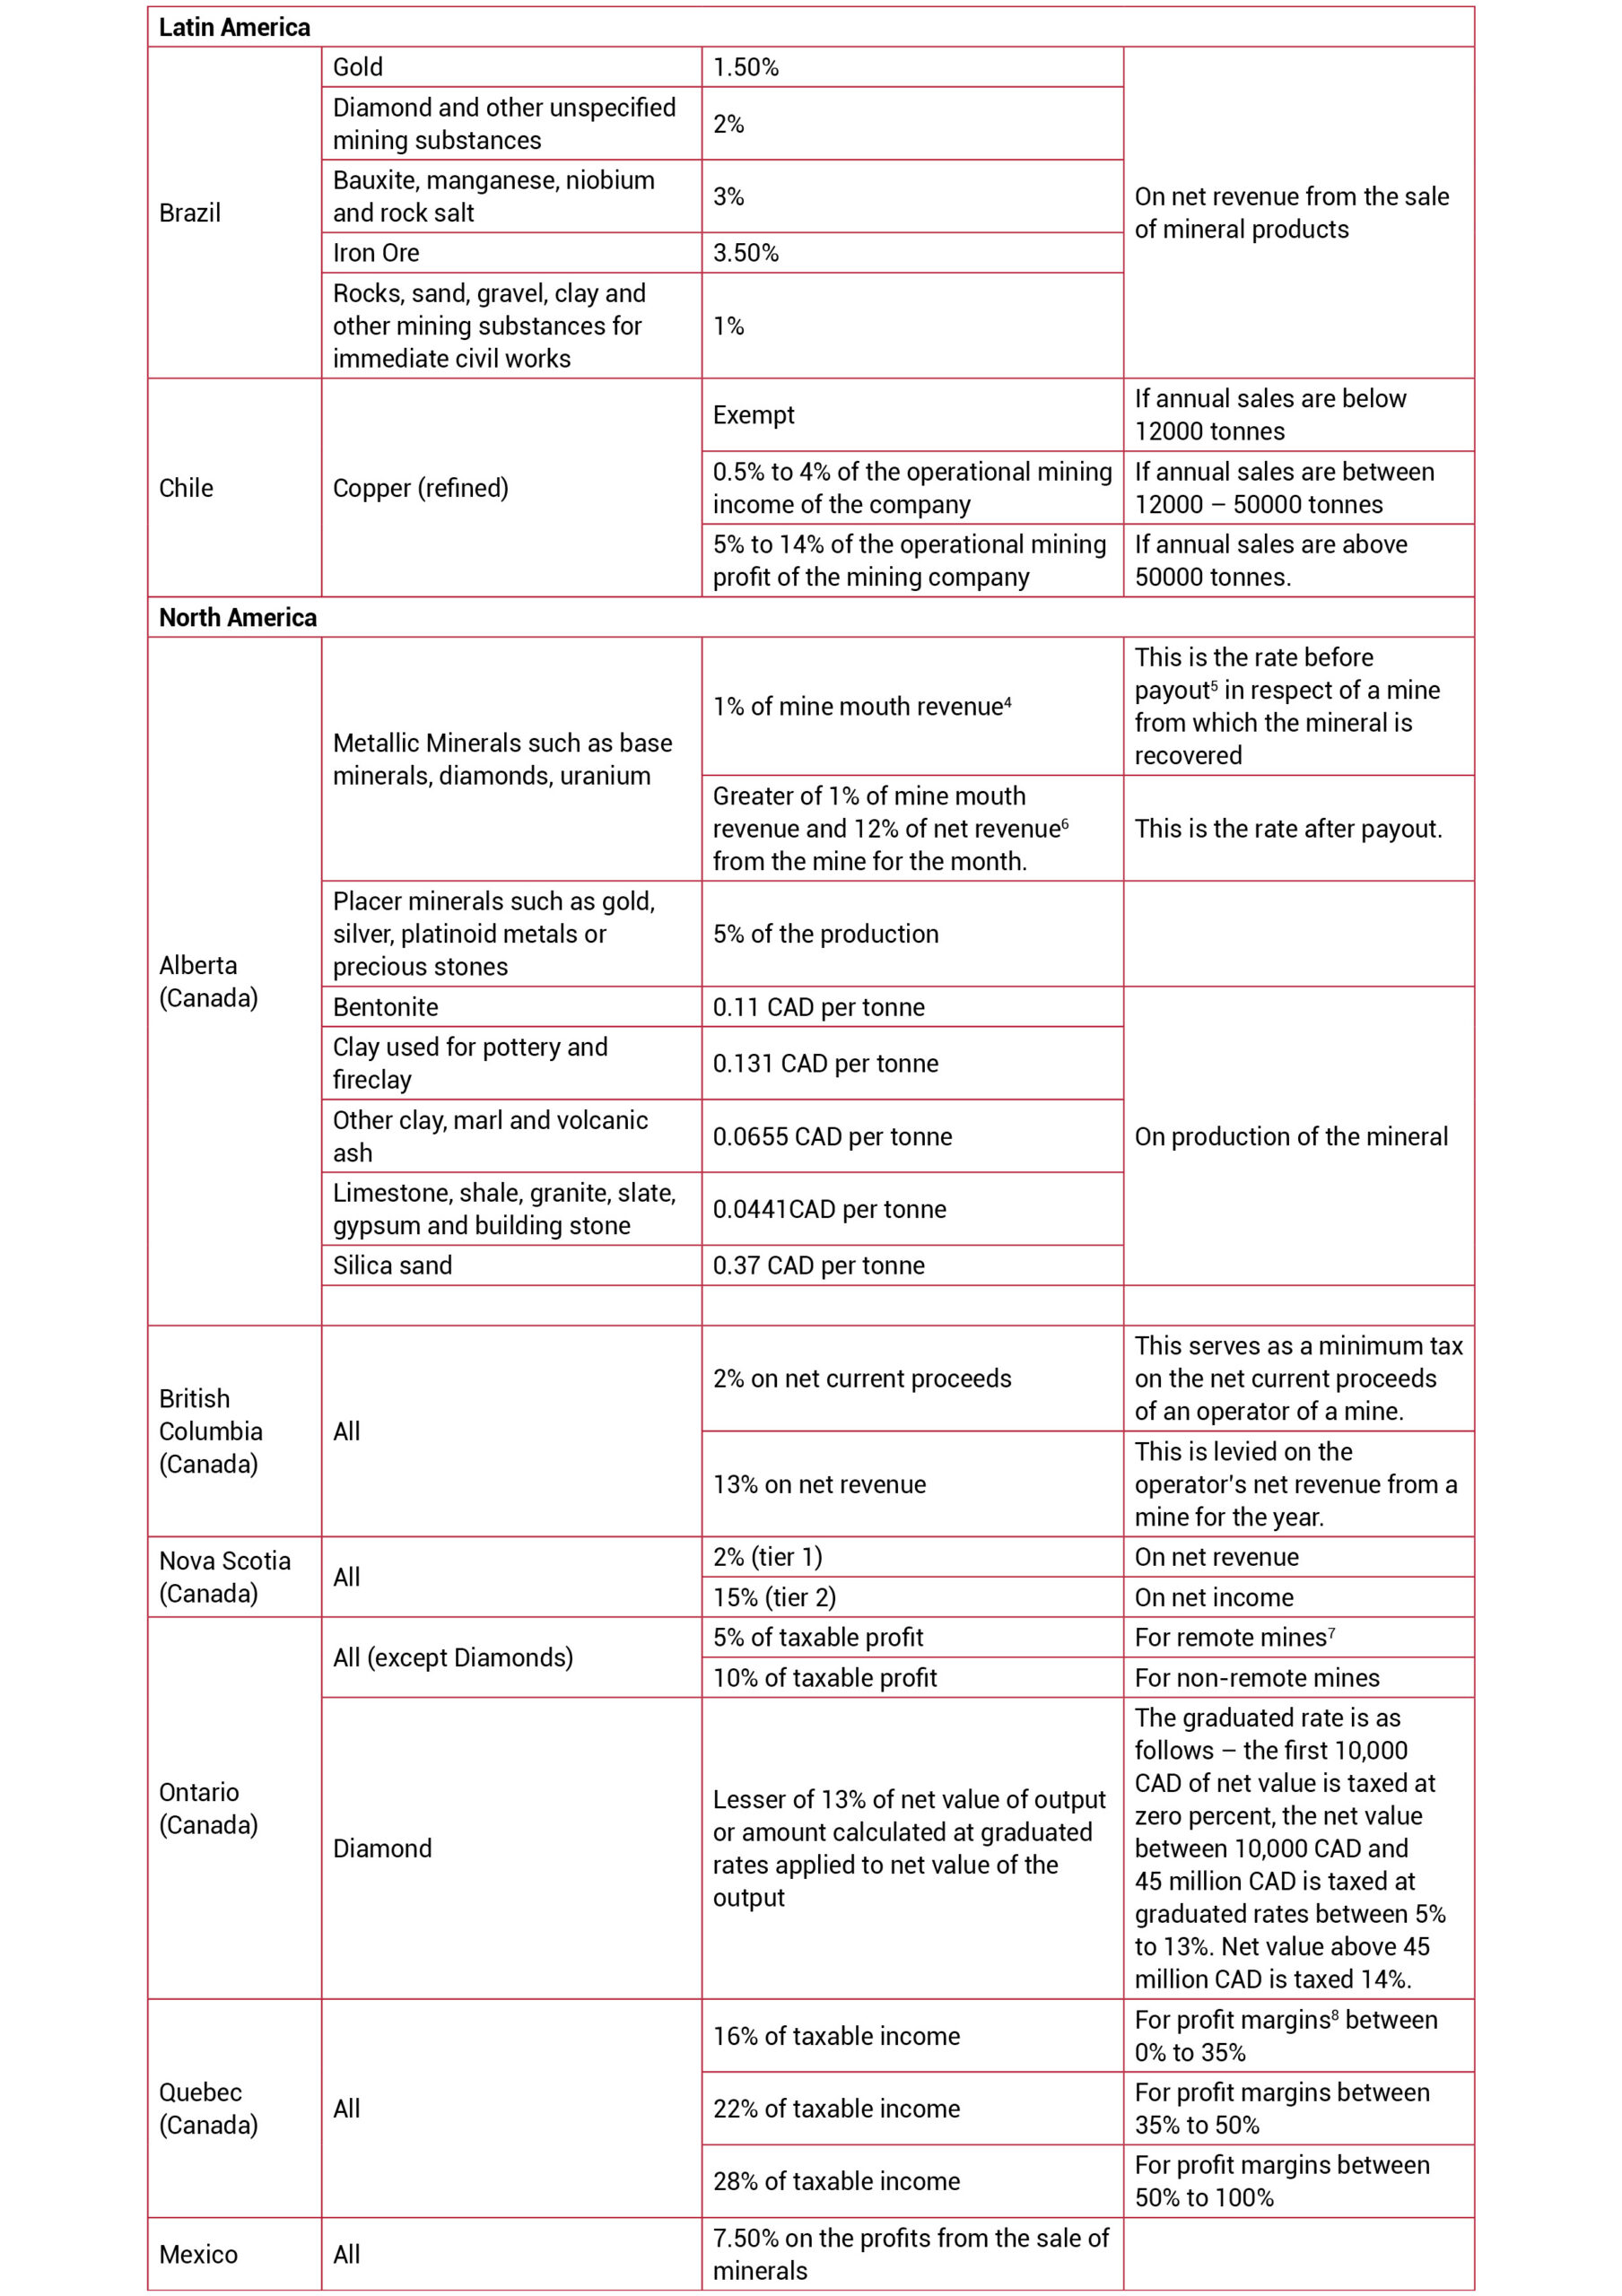
Developed nations like Australia and Canada have adopted a combination of ad valorem and profit-based systems while African countries majorly use ad valorem royalties. In contrast, the Asian and Pacific countries use a combination of ad valorem and tonnage royalty systems. There are very few developing countries like Mexico and Brazil that have adopted the profit-based royalty system.
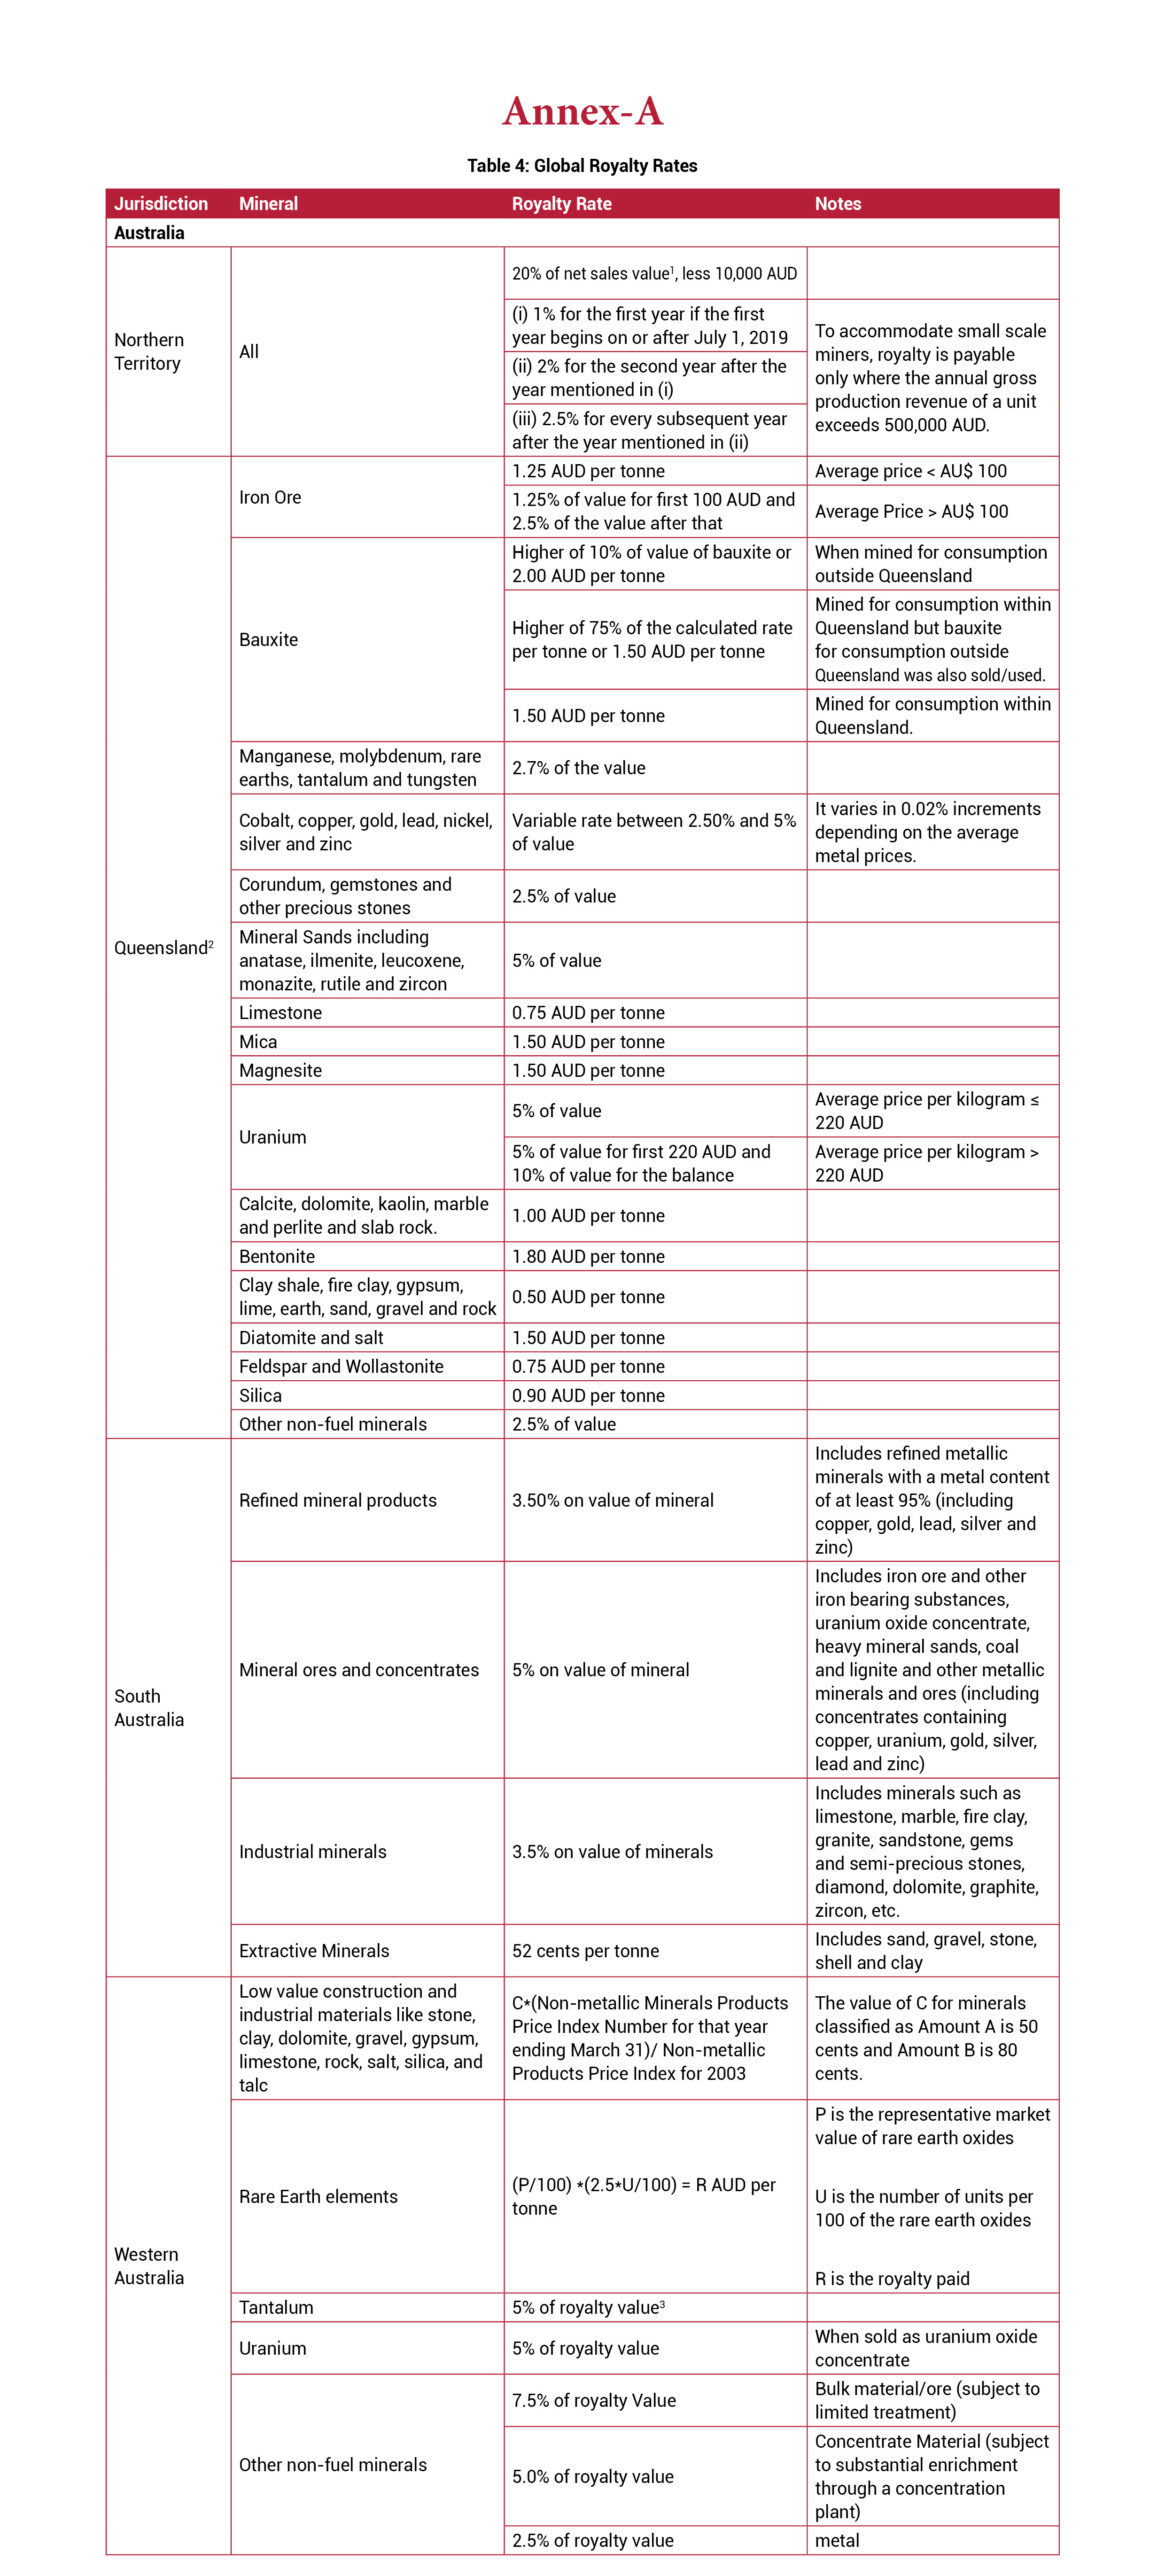
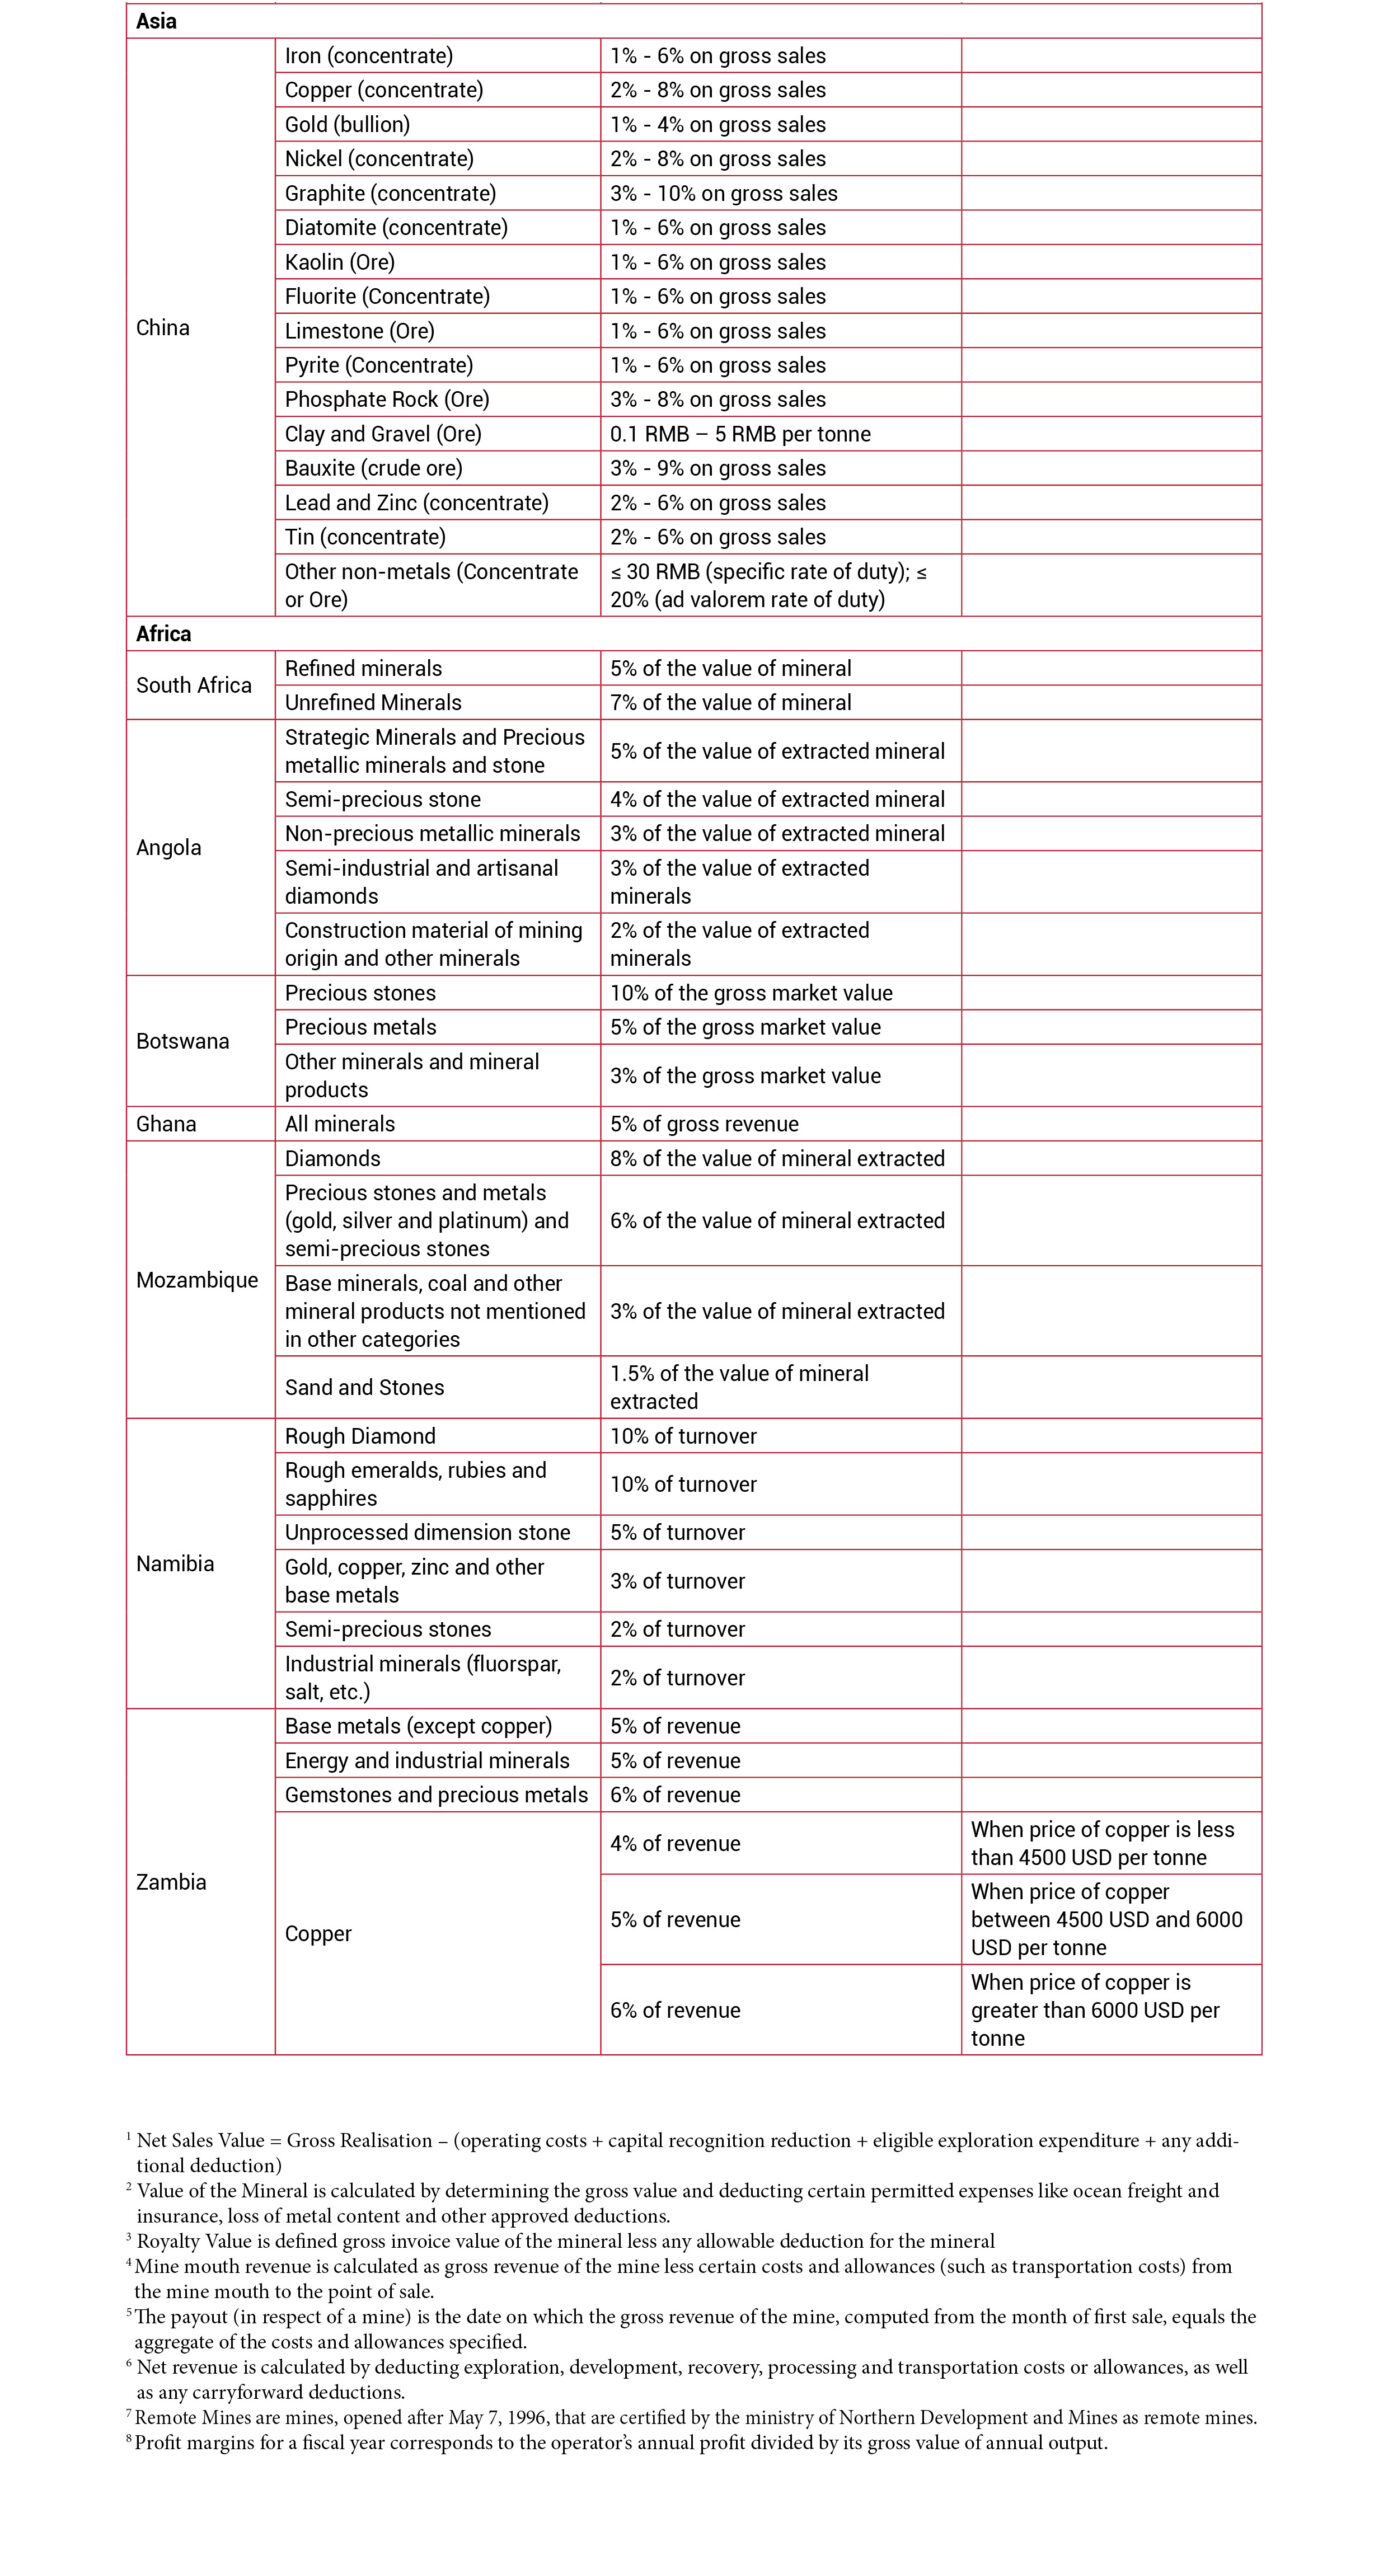
The research undertaken by the Government of Western Australia (2015) suggests that most countries apply ad valorem rates to coal, metallic minerals, and gemstones. But certain countries like Canada use only profit-based systems. Their research also shows that developed countries like Australia apply the specific rate royalties to low-value, high volume, non-metallic commodities, particularly construction material. A similar pattern is followed in India with specific rate royalties being applied to non-metallic, bulk minerals such as limestone and limeshell. The complete list of mineral royalty rates of the top 19 mining jurisdictions can be referred to in Annex-A.
4. Choice of royalty rates
Mineral sector taxation changes according to the business cycle. The governments take advantage of high commodity prices in a business cycle by adjusting their taxation rates. James Otto (2017) provides evidence of this in his research. He shows that during the “commodity price boom in 2002”, countries such as Liberia, Malawi, Solomon Island, and Zimbabwe introduced self-adjusting royalty schemes.
At the same time, tax policymakers must decide whether to apply a unique system for each economic sector or a common system for all sectors. Each economic sector has different costs, revenue, and government objectives like maximising employment or generating revenue. If the tax system is “non-uniform, it will be more complex and more difficult to administer” (Otto, 2017).
Yet most governments choose to design a unique mining tax system based on the following issues:
- Differentiating by mineral type: Many nations define groups of minerals that are subject to different royalty rates. This is the most common method as operating economies may vary between mineral types. For example, iron ore mines have the potential to generate higher profit levels than gravel mines, and hence, the royalty rate would be higher for iron ore mines. This method is applied by mining jurisdictions like India, Queensland (Australia), Brazil, and Alberta (Canada) among others.
- Differentiating by level of investment: There are a variety of mine sizes — small, medium, large, artisanal. Some mining jurisdictions exempt artisanal mines from paying royalty while small mines enjoy reduced royalty rates. The Northern Territory of Australia provides an exemption to small scale miners by applying royalty only where the annual gross production revenue of a unit exceeds 500,000 AUD. Chile and Quebec (Canada) use similar methods by assigning different rates to different sale amounts.
4.1. Summary of royalty rates in India
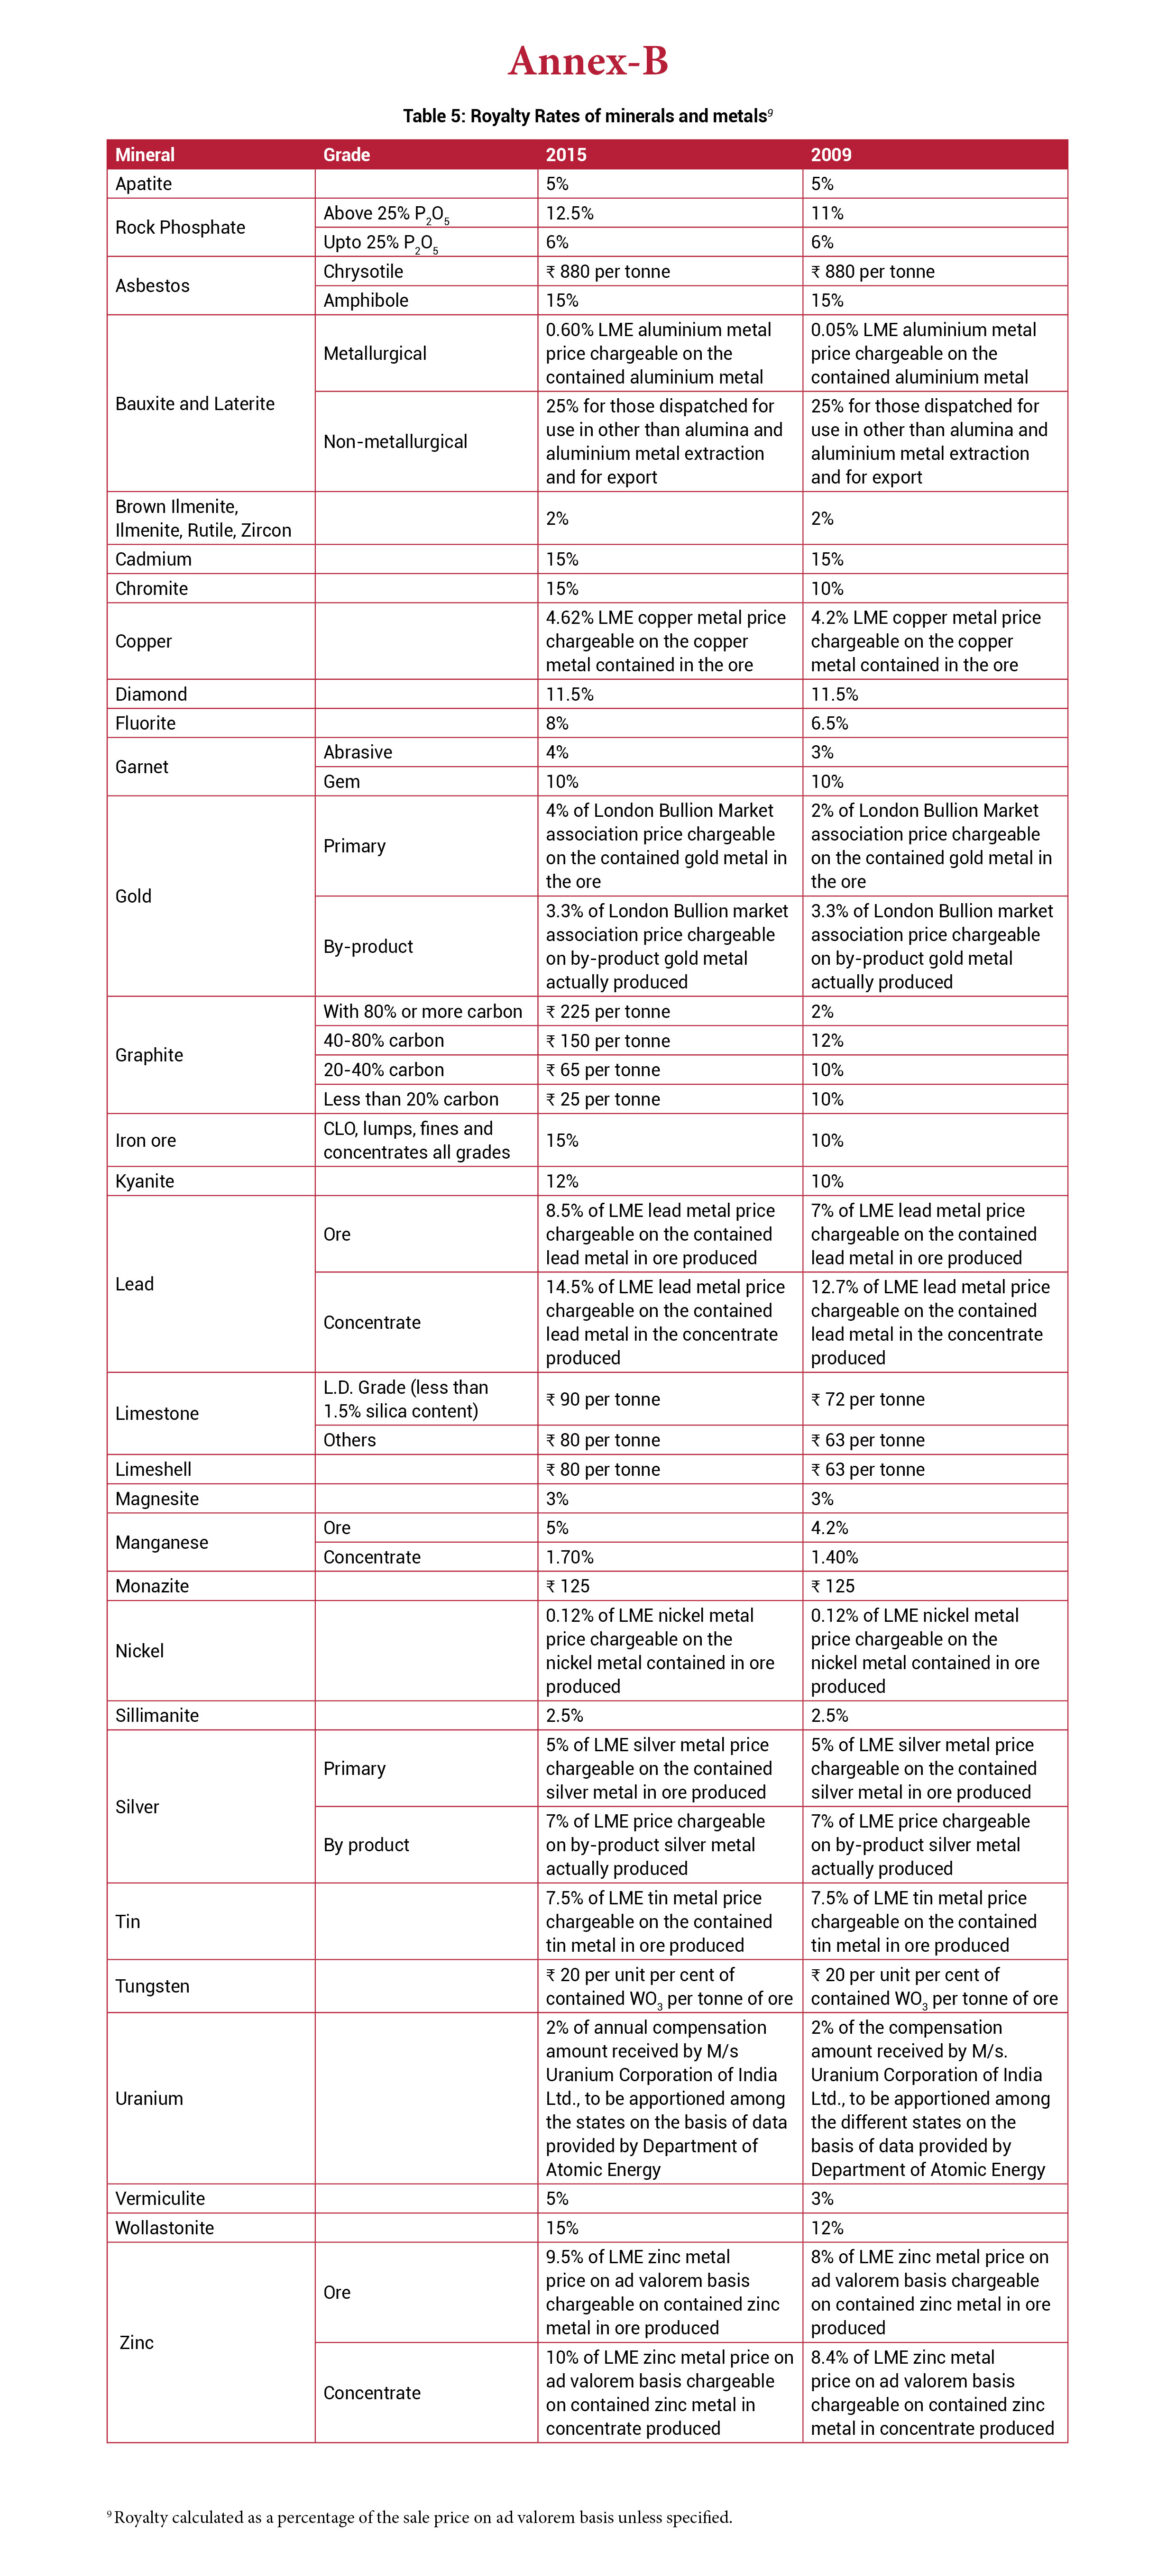
Of the major non-fuel minerals notified by the government (Second Schedule of MMDR, 2015), tonnage-based royalty rates are levied on only six major minerals of various grades. They are chrysotile, graphite (all grades), limestone (all grades), limeshell, monazite, and tungsten. The rest of the minerals/metals royalty rates are on an ad valorem basis. Their royalty rates range from 2% (Brown Ilmenite, Ilmenite, Rutile, and Zircon) to 25% (bauxite – non-metallurgical grade). The complete list of royalty rates can be found in Annex-B.
Figure 1 shows the movement of the tonnage-based royalty rates over the years. The shaded region shows the range of the tonnage rates. The figure shows a sharp increase in 1992 which was due to the removal of individual state cesses. These cesses were accommodated into the 1992 royalty rates. The mineral chrysotile (asbestos) has the highest tonnage rate (₹880 in 2015) over the years while tungsten has the lowest rate (Rs 20 per percent of WO3 per tonne of ore) since 2000. Until 1997, the tonnage royalty rates were as low as Rs 2 per tonne (manganese concentrate). The detailed royalty rates for 2009 and 2015 are shown in Annex-B. Table 2 specifies the lowest and highest tonnage royalty rates from 2000 to 2015.
Figure 2 shows the movement of the ad valorem royalty rates over the years. The shaded area shows the range of the ad valorem rates. Figure 2 also shows an increase in 1992. A sudden decrease is observed in 1997 as the Study Group adopted the policy of liberalisation to make the rates comparable to international rates. The Study Group increased the minerals under ad valorem systems from four minerals (tin, diamond, cobalt, and antimony) in 1992 to 19 minerals (antimony, brown ilmenite, ilmenite, rutile, zircon, chromite, cobalt, copper, diamond, fluorite, garnet, gold, kyanite, magnesite, sillimanite, silver, tin, wollastonite, and zinc) in 1997. All of these minerals had low rates. In 1997, copper had the lowest royalty rate at 0.7% of the copper concentrate produced, prior to which copper royalty rate was fixed at ₹17 per percent of the copper metal contained in the ore (1992). On the other hand, seven minerals (antimony, cobalt, diamond, kyanite, magnesite, tin, and wollastonite) had the highest ad valorem rate at 10% of average sale price in 1997. From 2000, the lowest ad valorem royalty rate fell below 1%. Table 3 specifies the lowest and highest ad valorem royalty rates from 2000 to 2015.
The ad valorem rates prevailing in Western Australia were the reference point while deciding the rates in 2009 (Indian Bureau of Mines, 2011).
Figure 3 shows the changes in iron ore royalty levied by the government. It shows that the royalty transitioned to an ad valorem basis in 2009 at 10% of the average sale price. Iron ore royalty also shows an increasing trend over the years. Furthermore, there was an increase in the royalty rate from 10% in 2009 to 15% in 2015. The dashed line (projected tonnage rates) shows the ad valorem rates as tonnage-based rates. They were calculated by multiplying the average sale price for the year with the ad valorem rates (Adams (2007); Stawowy (2001)). This shows that from 2009, the royalty rate has increased significantly.
Figure 4 shows a comparison of the countries that use ad valorem royalties for iron ore. India has the highest royalty by about seven to eight percentage points.
Jurisdictions like Queensland (Australia), South Australia and Alberta (Canada) that fall under the category of developed nations generally use profit-based royalty rates ranging from 1.25% (Queensland) to 12% (Province of Alberta) of the profits. Some developing nations like Mexico and Brazil have also transitioned to profit-based systems for iron ore with the rate ranging from 3.5% to 7.5%.
4.3. Bauxite royalty rates
Figure 5 shows the trend of the royalty rate on bauxite used for alumina/aluminum manufacturing while Figure 6 shows the trend of the royalty rate of non-metallurgical bauxite. The same methodology as mentioned for iron ore is used to calculate the projected tonnage rates. Till 2000, there was no distinction between metallurgical and non-metallurgical bauxite. They had the same royalty rates. Currently, non-metallurgical grade bauxite has a royalty as high as 25% of the average sale price. The royalty rates transitioned in 2000 to ad valorem systems (at 0.35% of the average sale price). Till 1997 (tonnage-based rates), an increasing trend can be observed.
Though the ad valorem rates remained unchanged from 2009 to 2015, the average sale price increased which is shown by the sudden upward shift of the projected tonnage rates from 2009 to 2015.
Figure 7 is a comparison between some jurisdictions that use ad valorem rates for bauxite. Other countries do not classify bauxite into metallurgical and non-metallurgical ore. India has the highest rate at 25% on an ad valorem basis. The current royalty rate for metallurgical bauxite is 0.6% of the LME aluminum metal price chargeable on the aluminum metal contained in the ore.
Developing nations like Brazil and Mexico levy about 3-8% royalty using profit-based systems. On the other hand, Queensland uses a hybrid system for bauxite – 75% of the profits or 1.5 AUD per tonne (whichever is higher).
4.4. Limestone royalty rates
Figure 8 shows the change in limestone royalty rates. They follow a tonnage-based system and show an increasing trend over the years with a period of stagnation from 1992 to 2000. Limestone is one of the few minerals that still has royalty on a tonnage basis.
Very few jurisdictions apply tonnage-based royalties for limestone. These include Queensland (Australia) at 0.75 AUD per tonne and Alberta (Canada) at 0.441 CAD per tonne.
4.5. Zinc royalty rates
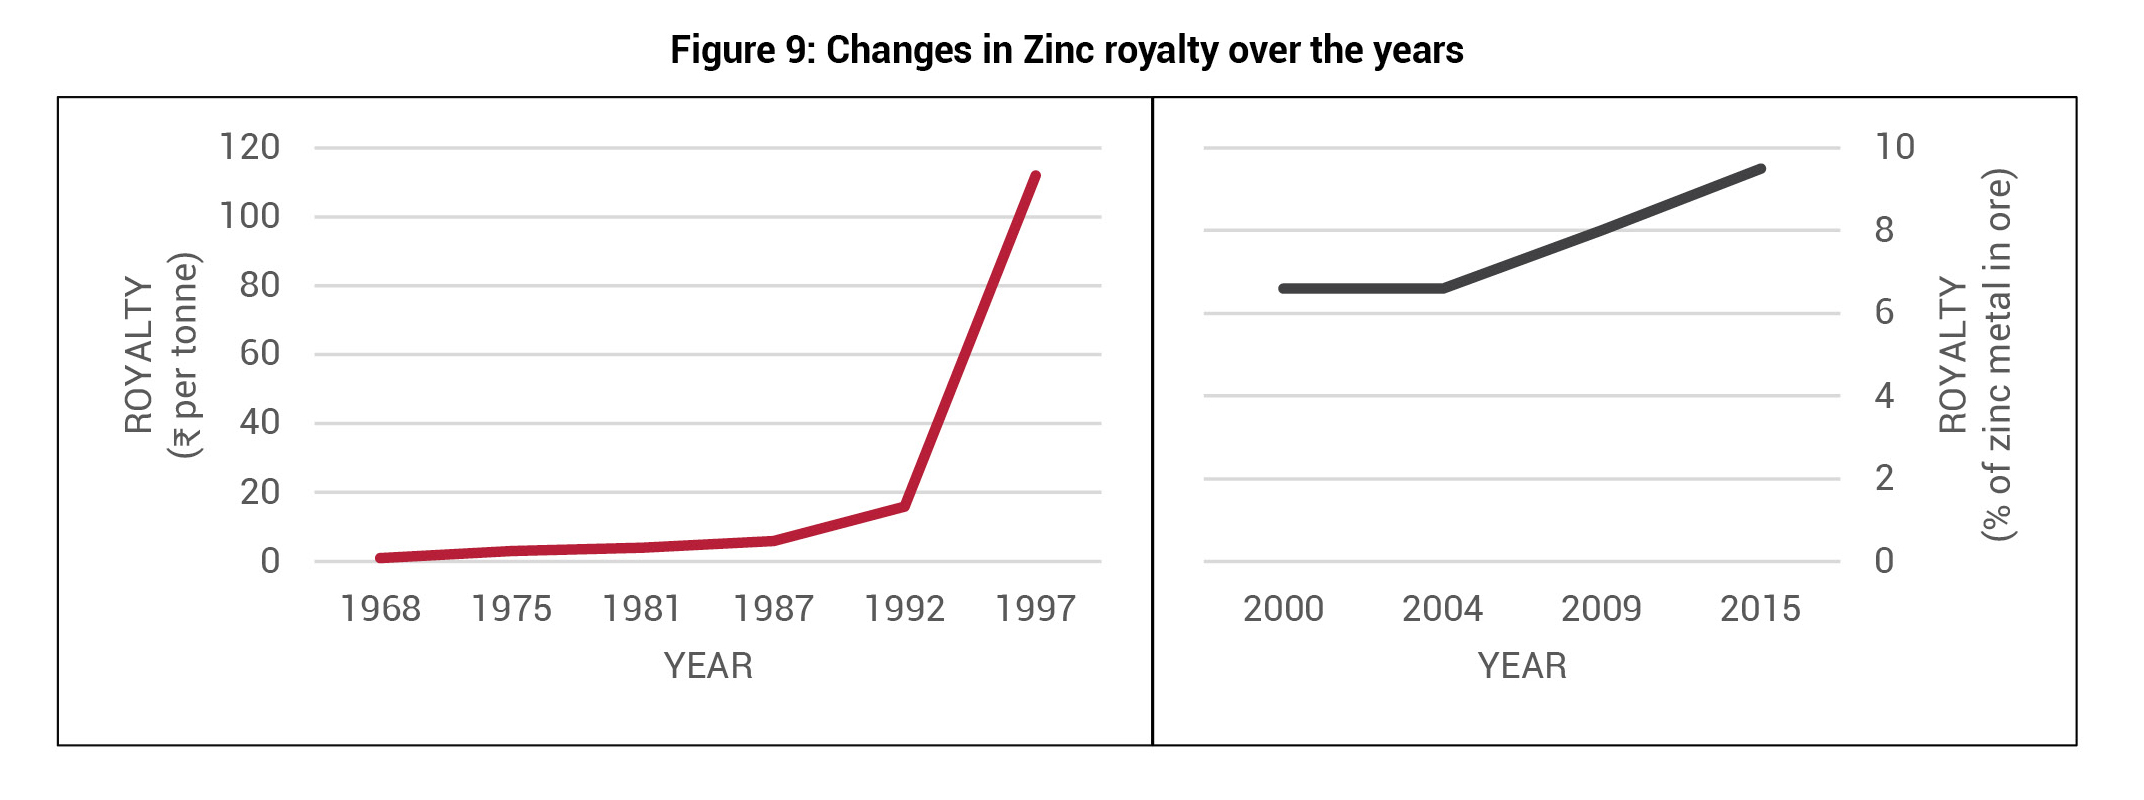
Figure 9 shows the transition of zinc royalty rates. Until 1968, zinc royalty was fixed on an ad valorem basis at 7% of the average sale price. From 1968-1997, the rates were based on tonnage regimes and were changed to ad valorem basis (linked with the LME prices) from 2000. Currently, the royalty is set at 9.5% of the LME zinc metal price chargeable on the zinc metal contained in the ore.
Only India links the royalty rates directly to the LME prices and the metal contained in the ore. For most jurisdictions, the zinc royalty rate is based on the metal produced/sold. Some countries like China base their rates on the zinc concentrate sold (2% – 6% of the gross zinc sales) while South Australia charges royalty on the zinc ore produced (5% of the net value of zinc ore).
5. Economic issues
Certain economic issues need to be kept in mind while determining the royalty rates:
- Investor Perceptions: As investor perceptions are very important, taxation levels need to be set at the optimal level. If the taxation is too high, the investors shift focus to other alternatives whereas if they are too low, the country loses revenue used for public welfare. If governments levy high levels of rent from “currently operating mines which are captive to the country in which their resources are located, it would discourage future exploration and development in the country and redirect capital towards countries with more attractive and stable mining regimes” (Guj, 2012).
- Administrative Ease: A system that enables easy administration and does not give scope to leakages should be adopted. Hence, “a complete range of royalty options need to be adopted rather than limiting to simple methods” (Indian Bureau of Mines, 2011).
- Revenue Stability: As shown by Guj (2012), mineral commodity prices and revenue to mining projects are highly volatile. “Besides being economically inefficient, the stability of relying on fixed taxes prevents the government from sharing in the high rents when the commodity prices are high”(Guj, 2012).
- Productivity of mines: The cost of the mine needs to be taken into consideration while setting the royalty rates. Older mines would have higher operating costs than newer mines like in the case of old copper mines where copper is found much deeper in the earth and is very expensive to extract. The newer mines would also be more productive as higher-grade ores would be extracted first (Otto, 2017).
6. Concluding remarks
This discussion shows that India has moved away from tonnage royalty regime to ad valorem royalty regime, but internationally competitive rates have not been achieved yet. A comparison of iron ore and bauxite with international royalty rates showed that India has very high royalty rates compared to other jurisdictions whereas an analysis of limestone revealed that very few jurisdictions (Queensland and Alberta) follow tonnage-based systems. The analysis of zinc showed that India is the only country that directly links the royalties of metallic minerals to the LME price and the metal contained in the ore. Most of the other jurisdictions directly charge royalties on the metal. The advantage of linking royalty rates to the “metal contained in the ore” is that it allows for the variation in the mineral grades and obtain more revenue from higher-grade ores.
In its attempts to compare royalty rates between countries, the paper observes a lack of similarity between the royalty rates. This variation could be attributed to the differences in legal systems, their history, level of investor interest, national objectives, and other factors. There is no universal royalty rate, therefore, a system that is compliant to easy administration, stable revenue, and supports investor interests should be adopted.
Bibliography
Adams, P. D. (2007). Insurance against Catastrophic Climate Change:. Australian Economic Review.
Basu, R. (2017, February 5). Intergenrational Equity Case Study – Iron-ore Mining in Goa. Economic & Political Weekly, pp. 18-21.
Chakraborty, L. (2014, May). Public Policy on Non-Tax Revenue: Analysing the Impact of Mining Royalty on Competitiveness. National Institue of Public Finance and Policy.
Chakraborty, L. (2014). Revival of Mining Sector in India: Analysing Legislations and Royalty Regime. National Institue of Public Finance and Policy.
Chakraborty, L., Garg, S., & Singh, G. (2016). Cashing in on Mining: the Political Economy of Mining Regulations and Fiscal Policy Practices in India. National Institute of Public Finance and Policy.
Chamber and partners. (2020). Mining 2020 – Chile. Retrieved from https://practiceguides.chambers.com/practice-guides/mining-2020/chile
Chamber of Mines. (2020). Mining Tax Regime in Namibia. Retrieved from https://www.chamberofmines.org.na/index.php/mining-tax-regime/
Gajigo, O., Mutambatsare, E., & Ndiaye, G. (2012). Royalty Rates in African Mining Revisited: Evidence from Gold Mining. African Development Bank (AfDB).
Global Legal Group. (2020). Angola: Mining 2020. Retrieved from https://iclg.com/practice-areas/mining-laws-and-regulations/angola
Global Legal Group. (2020). Ghana: Mining 2020. Retrieved from https://iclg.com/practice-areas/mining-laws-and-regulations/ghana
Global Legal Groups. (2020). China: Mining 2020. Retrieved from https://iclg.com/practice-areas/mining-laws-and-regulations/china
Governement of Alberta. (2020). Mineral Royalties Information. Retrieved from https://www.alberta.ca/minerals-royalty-information.aspx#toc-0
Governement of Western Australia. (n.d.). Mineral Royalties. Retrieved from http://www.dmp.wa.gov.au/Minerals/Royalties-1544.aspx
Government of Western Autralia. (2015). Mineral Royalty Rate Analysis Final Report. Department of Mines and Petroleum.
Guj, P. (2012). Mining Royalties and other mining-specific taxes. International Mining for Development Centre.
Hogan, L. (2008). International Minerals Taxation: Experience and Issues. IMF.
Indian Bureau of Mines. (2011). Mineral Royalties.
Northern Territory Governement. (2019). Mining Royalty Act. Retrieved from https://nt.gov.au/__data/assets/pdf_file/0003/470658/Mineral-Royalty-Act-overview-I-MR-003-2.pdf
Otto, J. (2017). The Taxation of Extractive Industries. UNU-WIDER.
Otto, J., Andrews, C., Cawood, F., Doggett, M., Guj, P., Stermole, F., . . . Tilton, J. (2006). Mining Royalties: A global study of their impact on Investors, Government, and Civil Society. World Bank.
South Australian Governement . (2011). Mining Act 1971. Retrieved from http://www.energymining.sa.gov.au/__data/assets/pdf_file/0010/246988/Gazette_30_June_2011_Pg_2773.pdf
State of Queensland. (n.d.). Mineral Royalty rates. Retrieved from https://www.business.qld.gov.au/industries/mining-energy-water/resources/minerals-coal/authorities-permits/payments/royalties/calculating/rates
Stawowy, W. (2001). Calculation of Ad valorem Equivalents of Non-Ad Valorem Tariffs—Methodology Notes.
Thomas Reuters. (2019). Mining in Mozambique. Retrieved from https://uk.practicallaw.thomsonreuters.com/0-575-3315?__lrTS=20200114014850990&transitionType=Default&contextData=(sc.Default)&firstPage=true&bhcp=1#co_anchor_a500582

Find on this page
The Centre for Social and Economic Progress (CSEP) is an independent, public policy think tank with a mandate to conduct research and analysis on critical issues facing India and the world and help shape policies that advance sustainable growth and development.