Reconciling DisCom ‘stimulus’ and dues: We must look beyond the tip of the iceberg
Reading Time: 28 minutesAs part of the “stimulus” packages announced by the central government due to COVID-19, Rs. 90,000 crore was initially earmarked for electricity Distribution Companies (DisComs).[1] This “stimulus” (cash flow relief) was meant to address DisComs’ financial difficulties, and the government subsequently announced that it could be extended to a limit of Rs. 1.25 lakh crore. This was widely reported[2] to be large enough to bridge the gap of dues to upstream generators (who themselves owe significant money to their own suppliers).
DOWNLOADS
Proponents of this relief package acknowledge that it merely amounts to loan-financed liquidity, and is not a grant or write-off. However, we find the true picture of shortfalls, cash requirements, and generator dues to be multiple times worse than the roughly Rs 100,000 crore discussed widely in the press, which might be based on the government’s PRAAPTI portal.[3] The incomplete nature of PRAAPTI fails to reflect that the generator dues alone are about double this amount. The actual total dues and short-term liabilities are multiple times higher. Our calculations are based on earlier data that do not reflect the full extent of COVID-19 implications, which will only show up meaningfully in FY2020-21. This means that while the stimulus may be helpful, and even necessary, it will not be anywhere near sufficient.
Such relief also doesn’t begin to address larger structural distortions, where different stakeholders are treated differently, such as types of consumers, or types of generators (with or without a power purchase agreement, or PPA). Most importantly, there is an enormous focus on non-payment by DisComs to generators, but insufficient focus on non-payment to DisComs by state governments for electricity consumption or promised subsidies.
Most discourse also underplays dues to other suppliers and vendors beyond generators, in addition to other dues or liabilities. DisComs will need support in the coming months, exacerbated by COVID-19 which has hurt their revenues more than simply the reduction in demand (because of the disproportional reduction in demand from high-revenue commercial and industrial consumers). Not only will the high shortfalls need more funding, but we should also look for new instruments beyond just loans. If there is a haircut to be taken, it should be equitably and realistically spread through the ecosystem, and not just by DisComs. The concentration of the challenges in selected states also emphasises the limits to a one-size-fits-all approach.
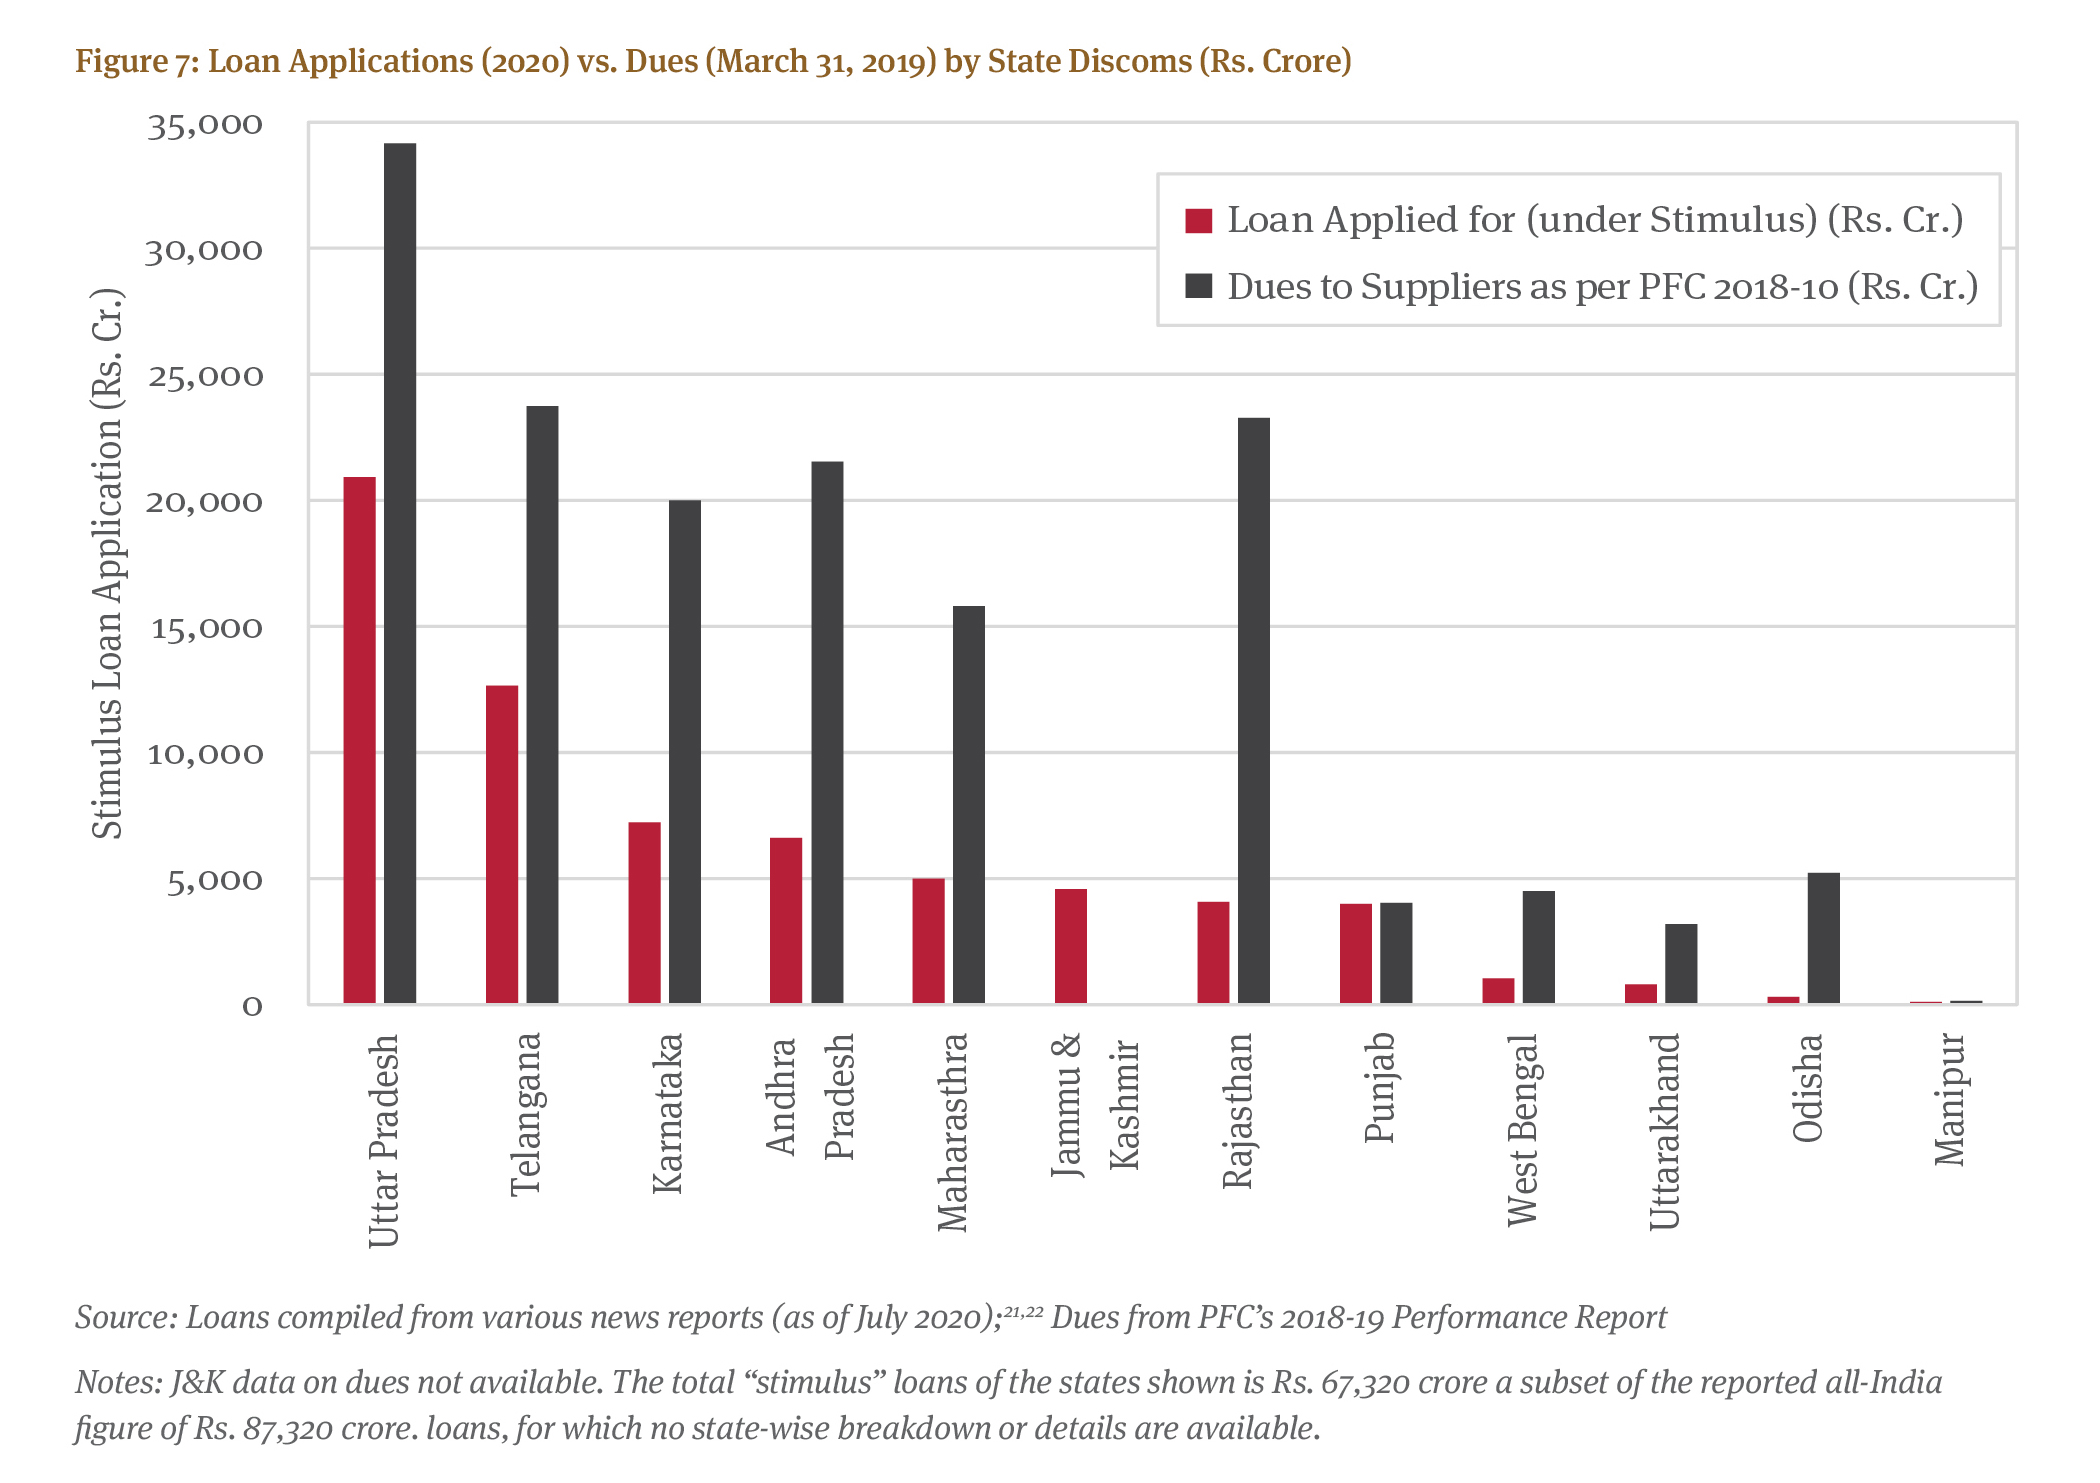
In the backdrop of COVID-19 and its unprecedented shock to the economy, the Government of India initially announced a relief of Rs 90,000 crore to assist the stressed electricity distribution sector[4] for liquidating their dues to suppliers like generation companies (GenCos) and transmission companies (TransCos) via loans through the Power Finance Corporation Ltd. (PFC) and the Rural Electrification Corporation Ltd. (REC). According to press reports at the time of writing,[5] PFC and REC together received applications for Rs. 87,320 crore from distribution companies/utilities (DisComs)[6] (Figure 7). This number may rise as more states debating the loans take the plunge.
Was this amount appropriate or sufficient? To answer this key question, we must first examine DisCom finances including several sets of dues, not just payables by DisComs, but also receivables to DisComs.
For a mostly monopolistic, regulated (rate-of-return) entity like a DisCom, why should there be financial losses? Why should they have dues (unpaid bills) to generators who supply them power? After all, both sides of DisCom financials are regulated – what they have to pay (expenses, overwhelmingly for power purchase) and what they can earn (revenues). A subtle but very important aspect of this equilibrium involves a range of assumptions that regulators make or impose upon DisComs. It is only based on these that they are able to earn a statutory rate of return.
If one looked at the aggregate income statements for DisComs, like compiled in PFC’s Reports on Utility Performance,[7] these lists all the revenues and expenses of DisComs. Correction, they list the booked values, which assume all incoming cash flows are actually received and all outgoing are actually paid out. The unpaid dues to generators make headlines but there are many other headings of both expenses and revenues which don’t materialise as booked, and merit attention.
Even a cursory glance at the income statement shows a net deficit (annual expenses > revenues), and the balance sheets, which apportion utility assets across liabilities and equity, are also not very healthy. In fact, for FY2018-19, the liabilities were greater than the assets (!), but that is the topic of another paper. However, very little attention is given to cash flow statements since these are not publicly available. Income statements rightfully focus on accrual accounting (book values), which is the norm in India based on an accounting standard that smooth out cash flow ups and downs to better reflect operations instead of delays in cash payments.
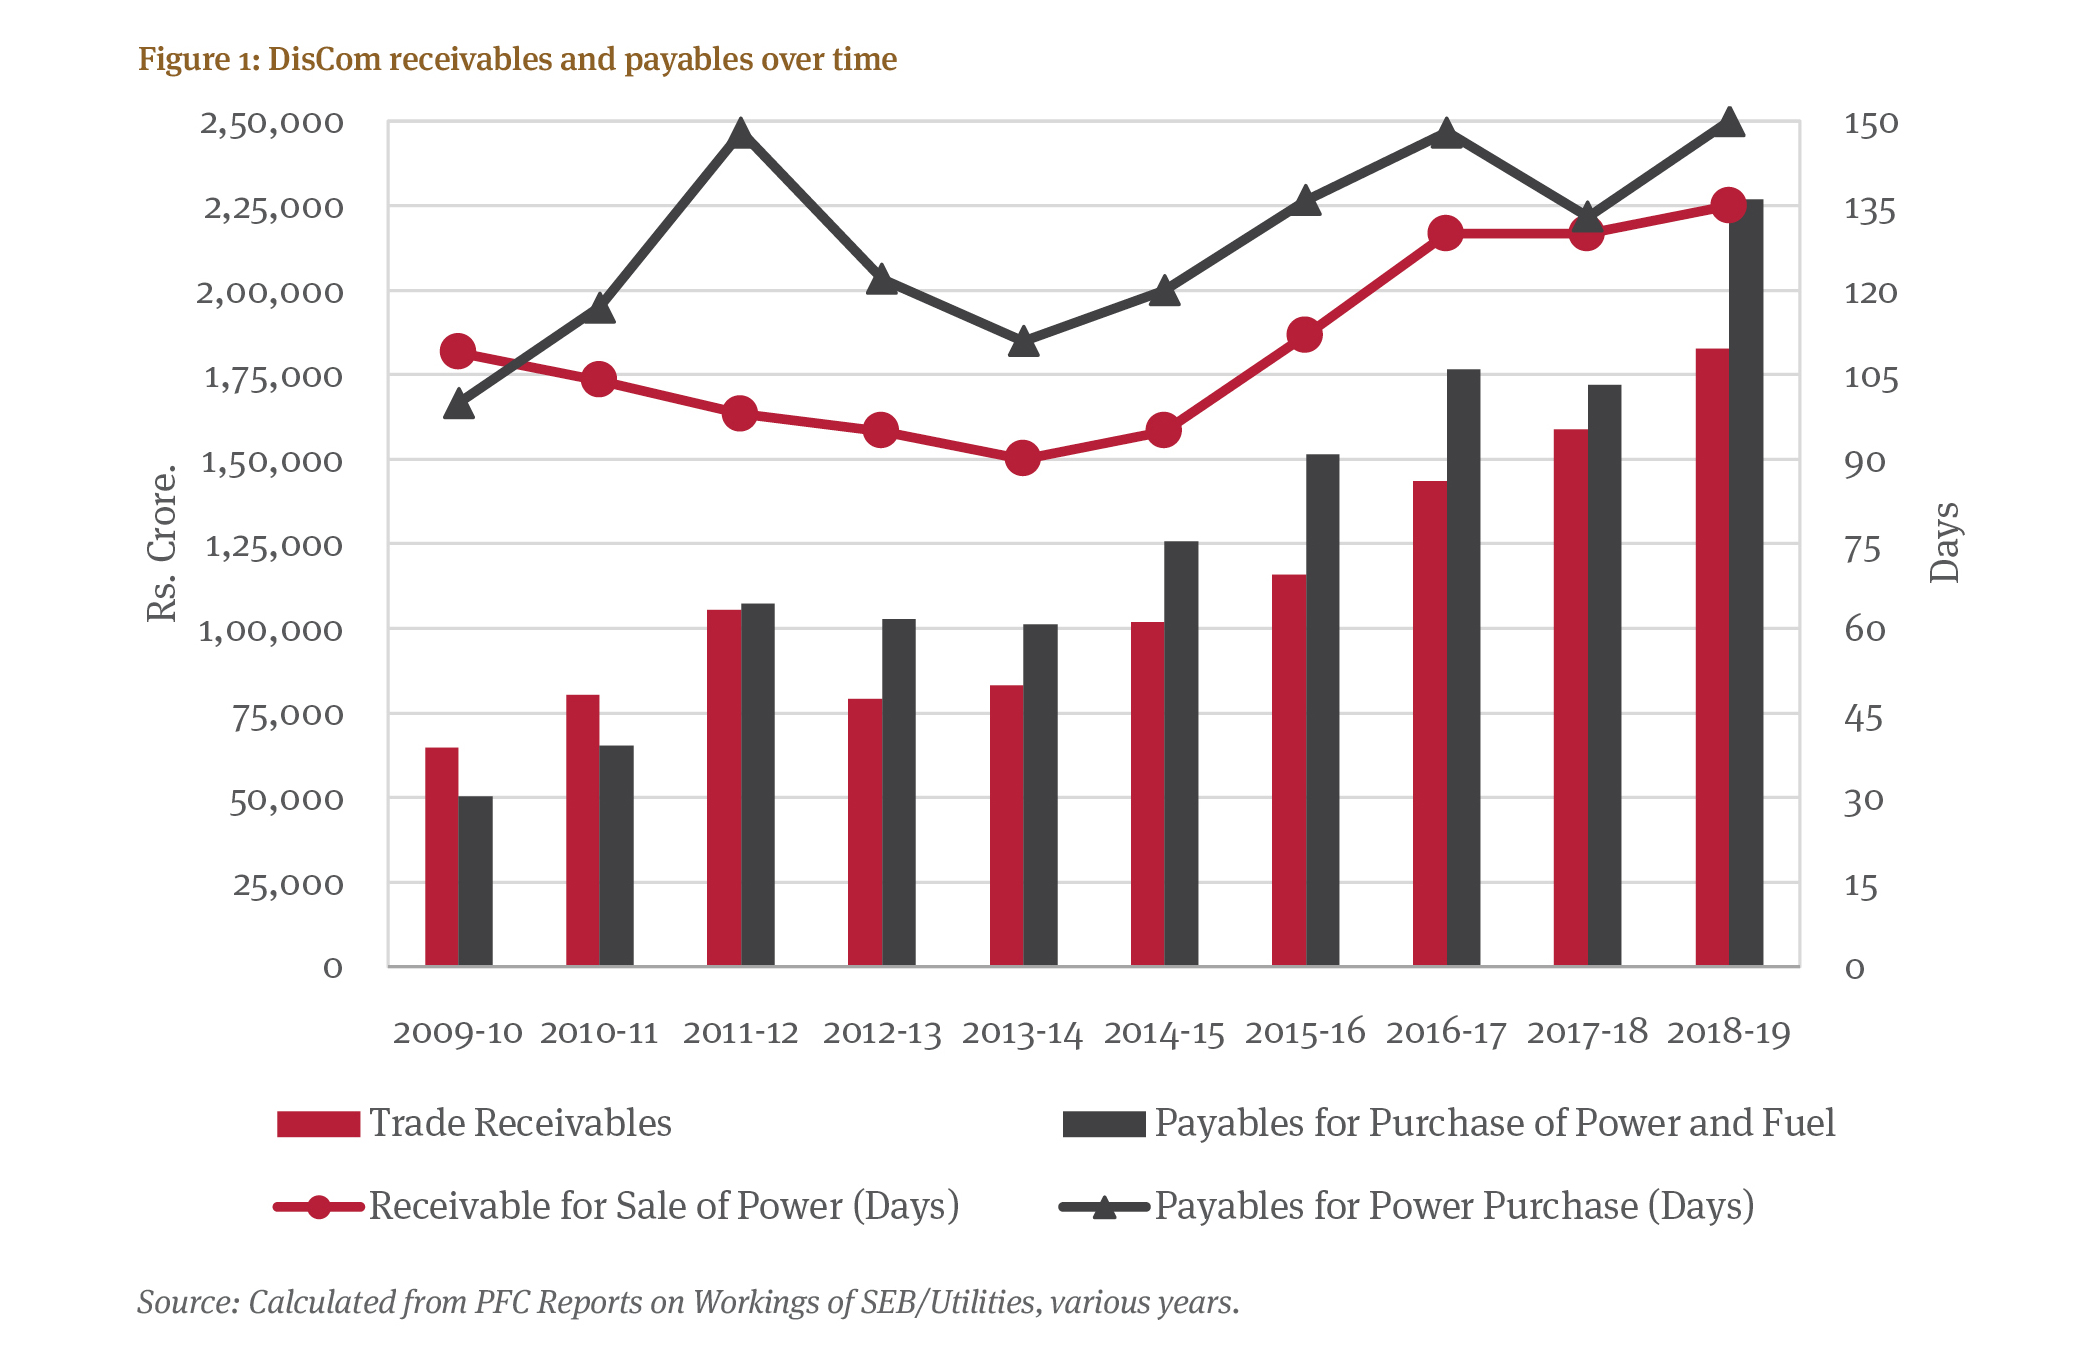
However, in the case of DisComs, we really need to see the cash flow statements as well for two reasons. First, like with all businesses, even if the book value appears healthy, cash matters. Lack of cash means either one must take loans (sometimes classified as working capital), or one has to delay payments until receivables come in. The receivables are measured not in days or weeks,[8] but many months, far exceeding the “normal” payment cycle. Second, an implicit assumption in accounting is that the differentials between cash and accrual accounting even out over time – different flows are expected to be late at different times. However, if we examine the books of utilities over time, we find that this isn’t true and there is a steady increase in the gap between cash and accrual accounting. This is seen in Figure 1 showing days of receivables and payables, which have increased between FY2009-10 and FY2018-19.
The upswing in days of payables or receivables hasn’t been monotonic. Why there was a dip (improvement) in days of receivables and even payables is an interesting question – one beyond the scope of this paper – but it could be related to operating discipline, more free cash flow etc. What is interesting is that there has been a crossover in FY2011-12, before which receivables were greater than payables in absolute terms.
Most conversations around the cash flow or even (book-value) income statement deficit revolve around electricity losses, often “commercial losses” which include theft as well as lack of billing and collection. The composite measure is dubbed aggregate technical and commercial (AT&C) losses, the latter spanning theft and non-collection.[9] AT&C losses are officially more than 20% on average in the country; the government’s UDAY portal has more details on such losses. They not only vary widely across states, but they also inherently have uncertainty because of the impossibility of quantifying unmeasured components (theft, technical losses, and unmetered consumption) except through underlying assumptions.
It’s important to note that, up to a point, such losses are normal because of the physics of transmitting electricity over wires, and these losses can never be zero. However, they certainly can be measurably lower than they are today.[10]
Today’s reference number for “acceptable” AT&C losses is 15% – in practice each DisCom is given slightly different targets, but government policy refers to 15% as a national goal. Any shortfall in achieving targeted AT&C loss by a respective DisCom would hit them financially based on aggregate revenue requirement (rate base) calculations. However, even if we assume regulators disallow all losses above the targeted (average 15%) AT&C loss, such a bounding exercise only creates a financial loss of 5% in aggregate, which doesn’t explain the very large unpaid bills. While handling the failure to meet AT&C targets is an important challenge, it isn’t the focus of this paper.
Receivables or dues to DisComs are a much bigger challenge for cash flows than AT&C losses. These are of two types. The first is subsidies from the state governments which may not have been received (Table 1), and the second is unpaid dues from consumers. A critical subset of the latter is dues from state governments for their consumption, which, put together with unpaid subsidies, results in state governments being responsible for the largest fraction of DisCom receivables.
3.1. Subsidies – A large share of revenues but often delayed
Independent regulators (the State Electricity Regulatory Commissions) are meant to set retail prices (tariffs) so that DisCom costs (rather, their allowed costs), are covered, inclusive of any statutory returns. Consumers by category (residential, agricultural, industrial, commercial, etc.) have tariffs that are not exactly equal to the DisCom cost of supply for several reasons. First, many categories have progressive (telescopic) tiers, or slabs, such that the category average includes smaller consumers, who are ostensibly poorer, paying less than the category average, offset by some within the category paying more. Second, categories themselves may differ based on a principle of cross-subsidy where commercial and industrial users typically overpay to offset underpayments by domestic and agricultural consumers. On paper, based on the Electricity Act 2003, the maximum cross-subsidy is meant to be 20%, but many states have far greater cross-subsidies.
Outside of cross-subsidies, state governments are free to provide a separate, explicit subsidy to lower the bills for selected consumers as they see fit. Thus, if the regulator sets an agricultural price of, say, 4.5 Rs./kWh the state can declare zero cost electricity for farmers by promising the tariff difference as a subsidy. As Table 1 shows, promised subsidies can be an enormous fraction of total cost structures, more so when we dig at a state-level (Table 2).
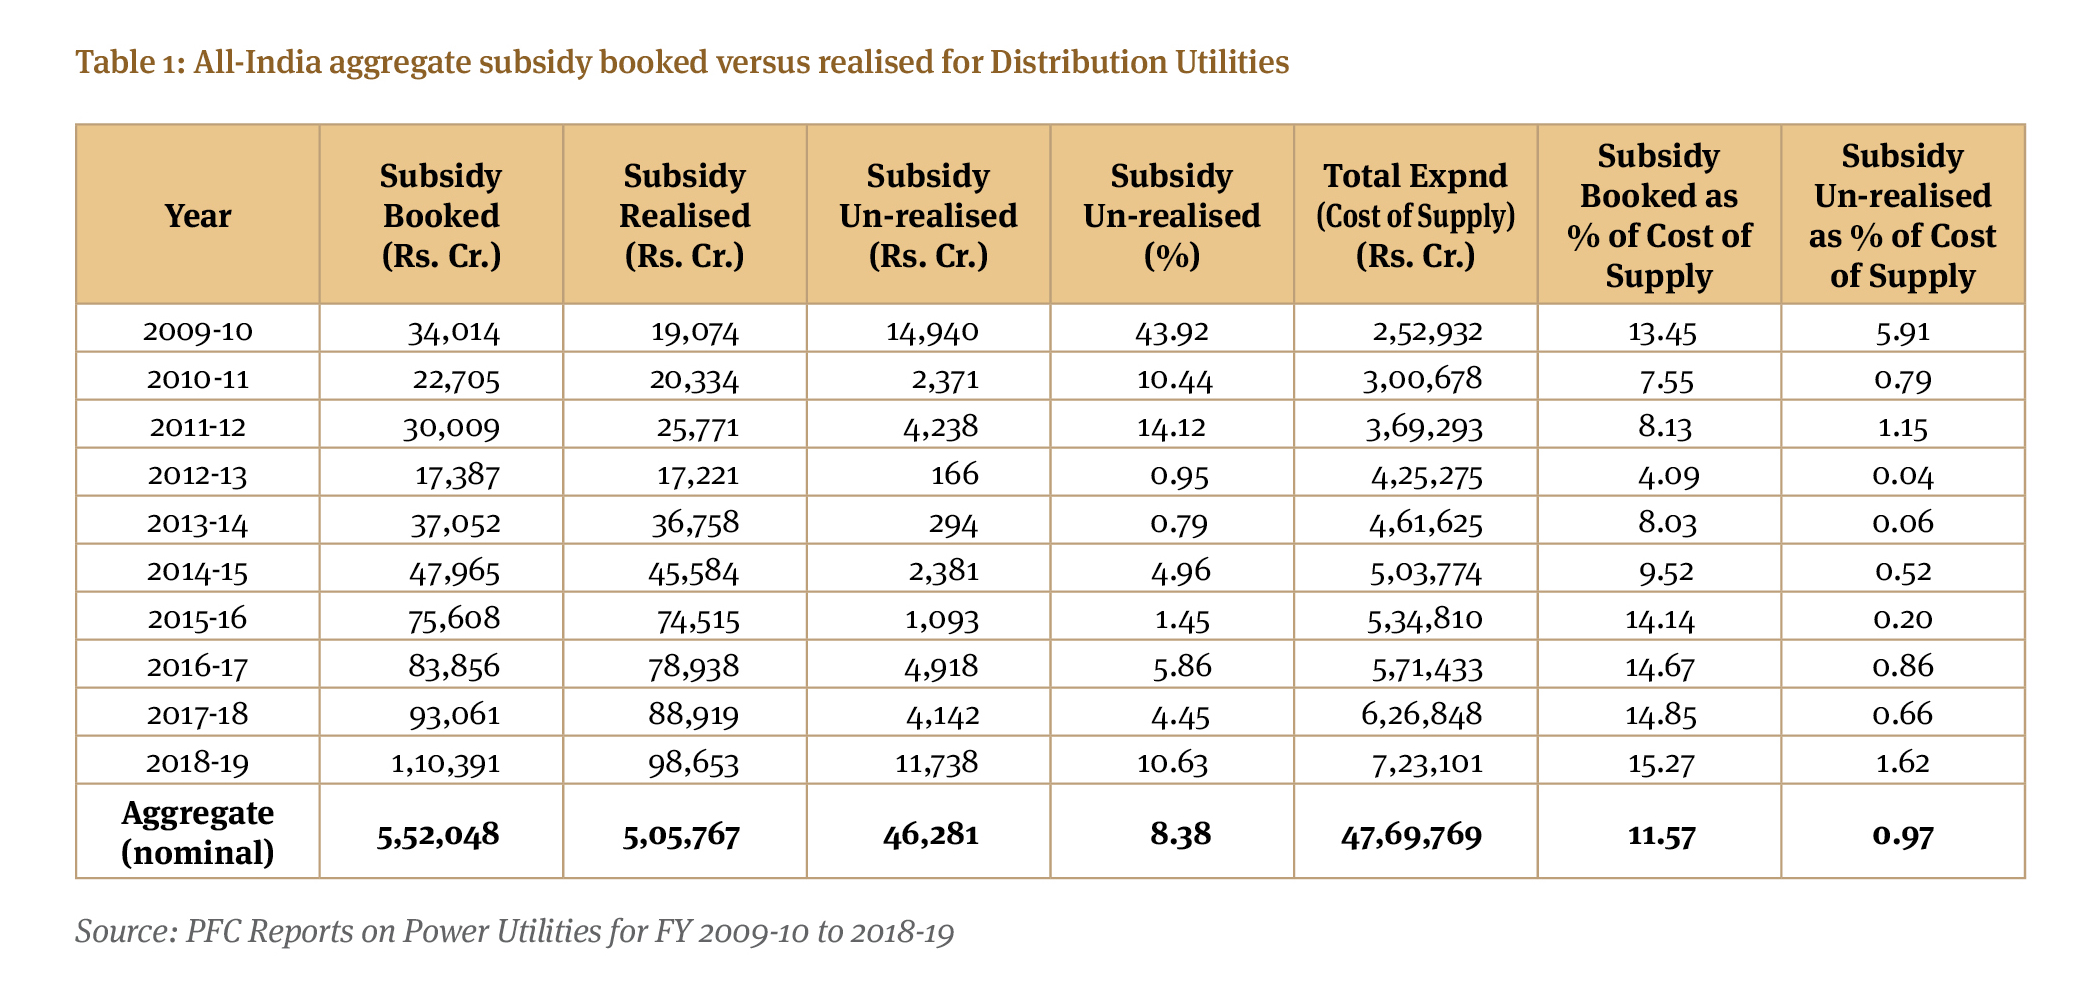
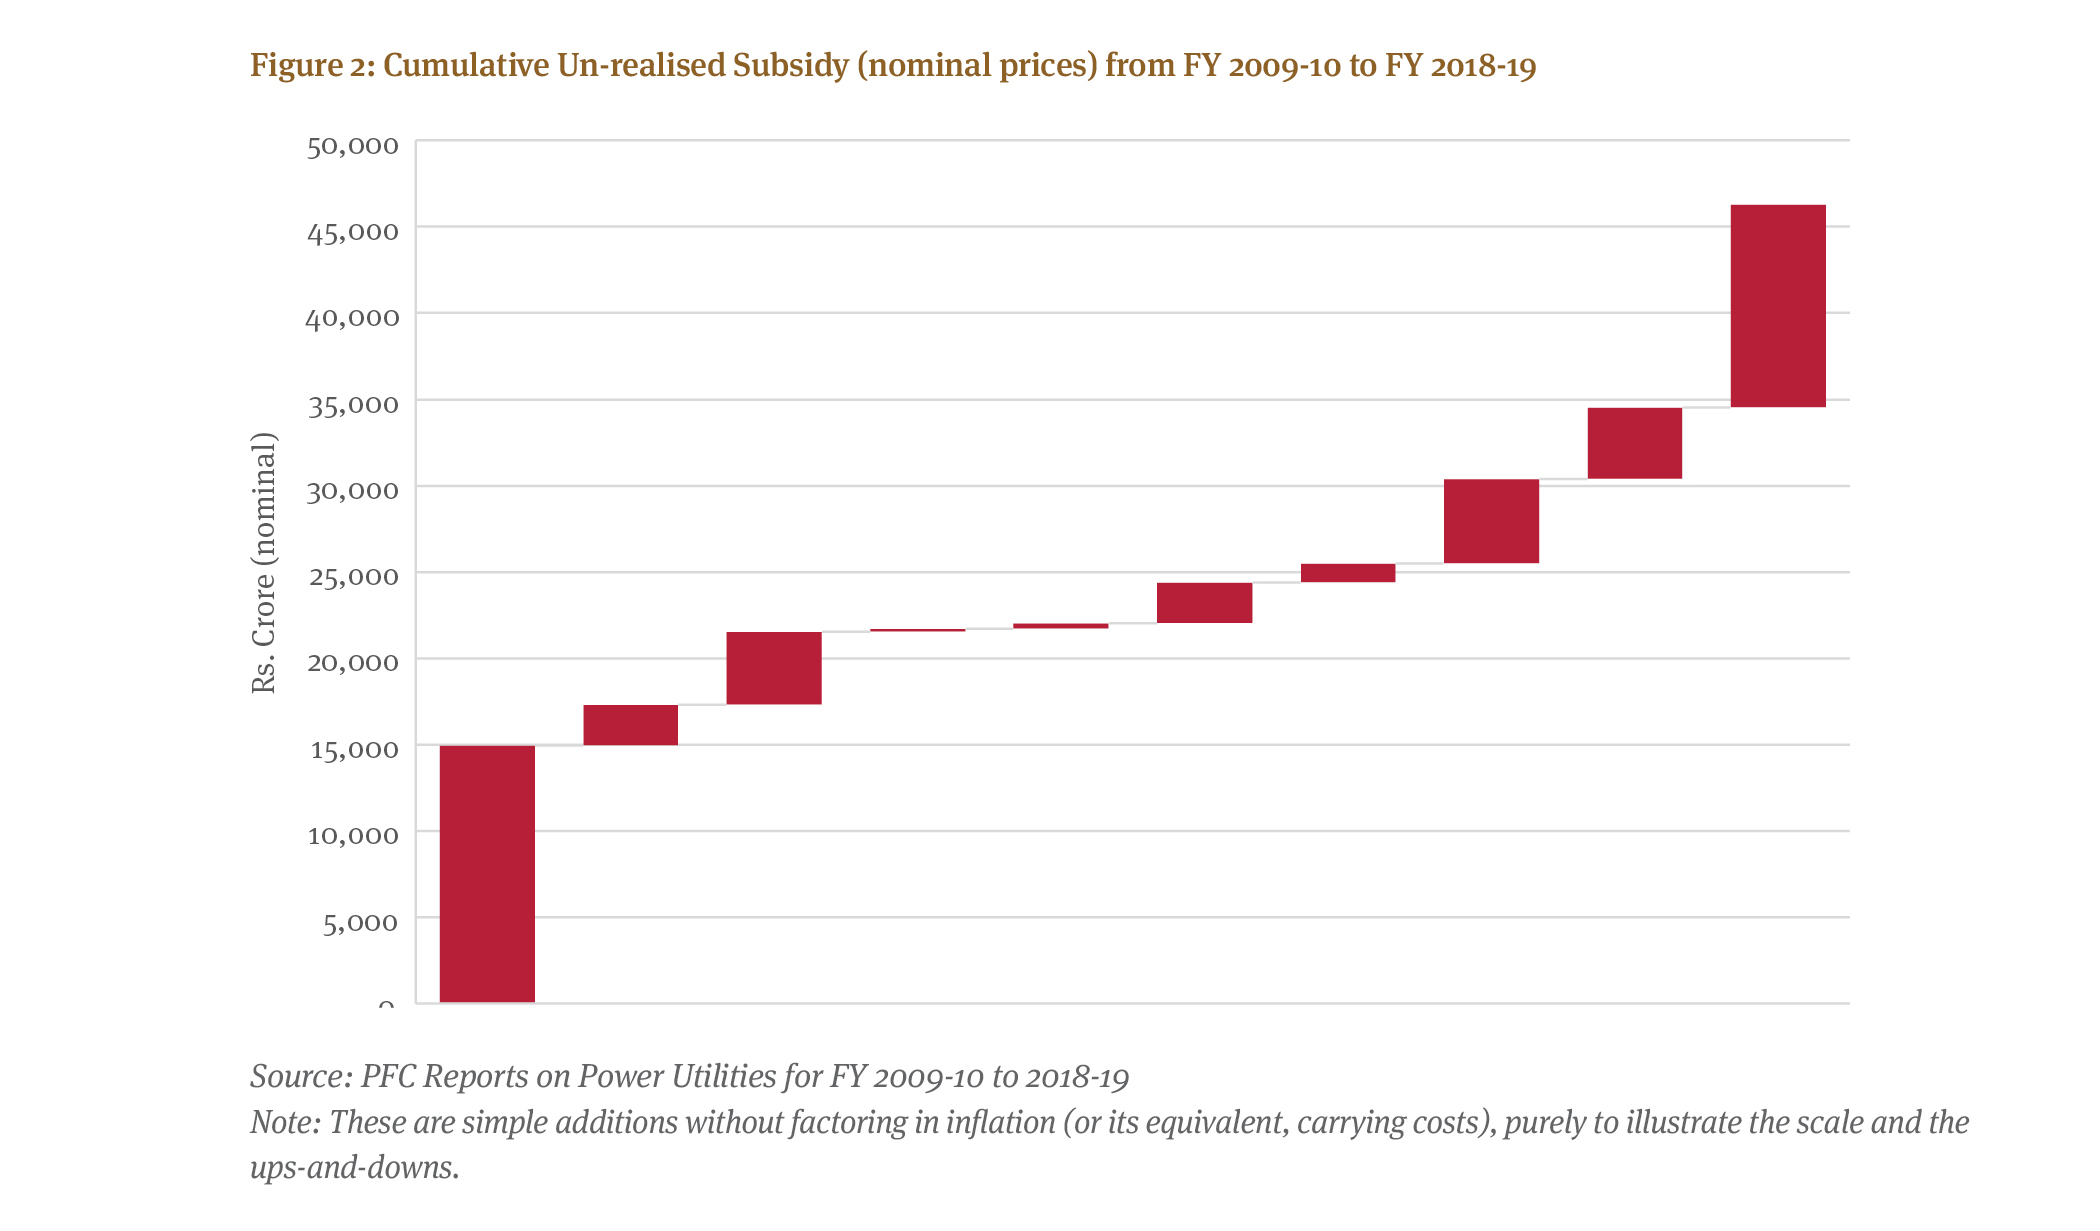
However, these are all mere promises, and the important question is whether subsidy payments are actually given on time. Evidently, there is measurable unpaid subsidy. According to the PFC Report on Utilities Performance for FY 2018-19, the un-realised subsidy was Rs. 11,738 crore. At first glance, in comparison with the annual value of electricity, this appears very modest (1.6%).[11]
However, if we add all the unpaid subsidies over time, these become a considerable amount. From FY 2009-10 through FY 2018-19 we calculate the cumulative unpaid subsidy as Rs. 46,281 crore (Figure 2). We can then put this aggregate into context by comparing it to DisComs’ aggregate cost structure (Table 1). Importantly, this total is without adding any carrying cost of such unpaid subsidy. At a hypothetical 10% rate, the carrying cost of such unpaid subsidy just between FY2009-10 and FY2018-19 exceeds Rs. 30,000 crore. Thus, from a cash flow perspective, this aggregate is now very substantial (in the order of 10% of FY2018-19 total costs). We also haven’t factored in any historical unrealised subsidy prior to FY2009-10 as PFC’s public databases on their website only begin with 2009-10 data. However, that year showed a very large unpaid subsidy, suggesting it might also have been high for prior years.
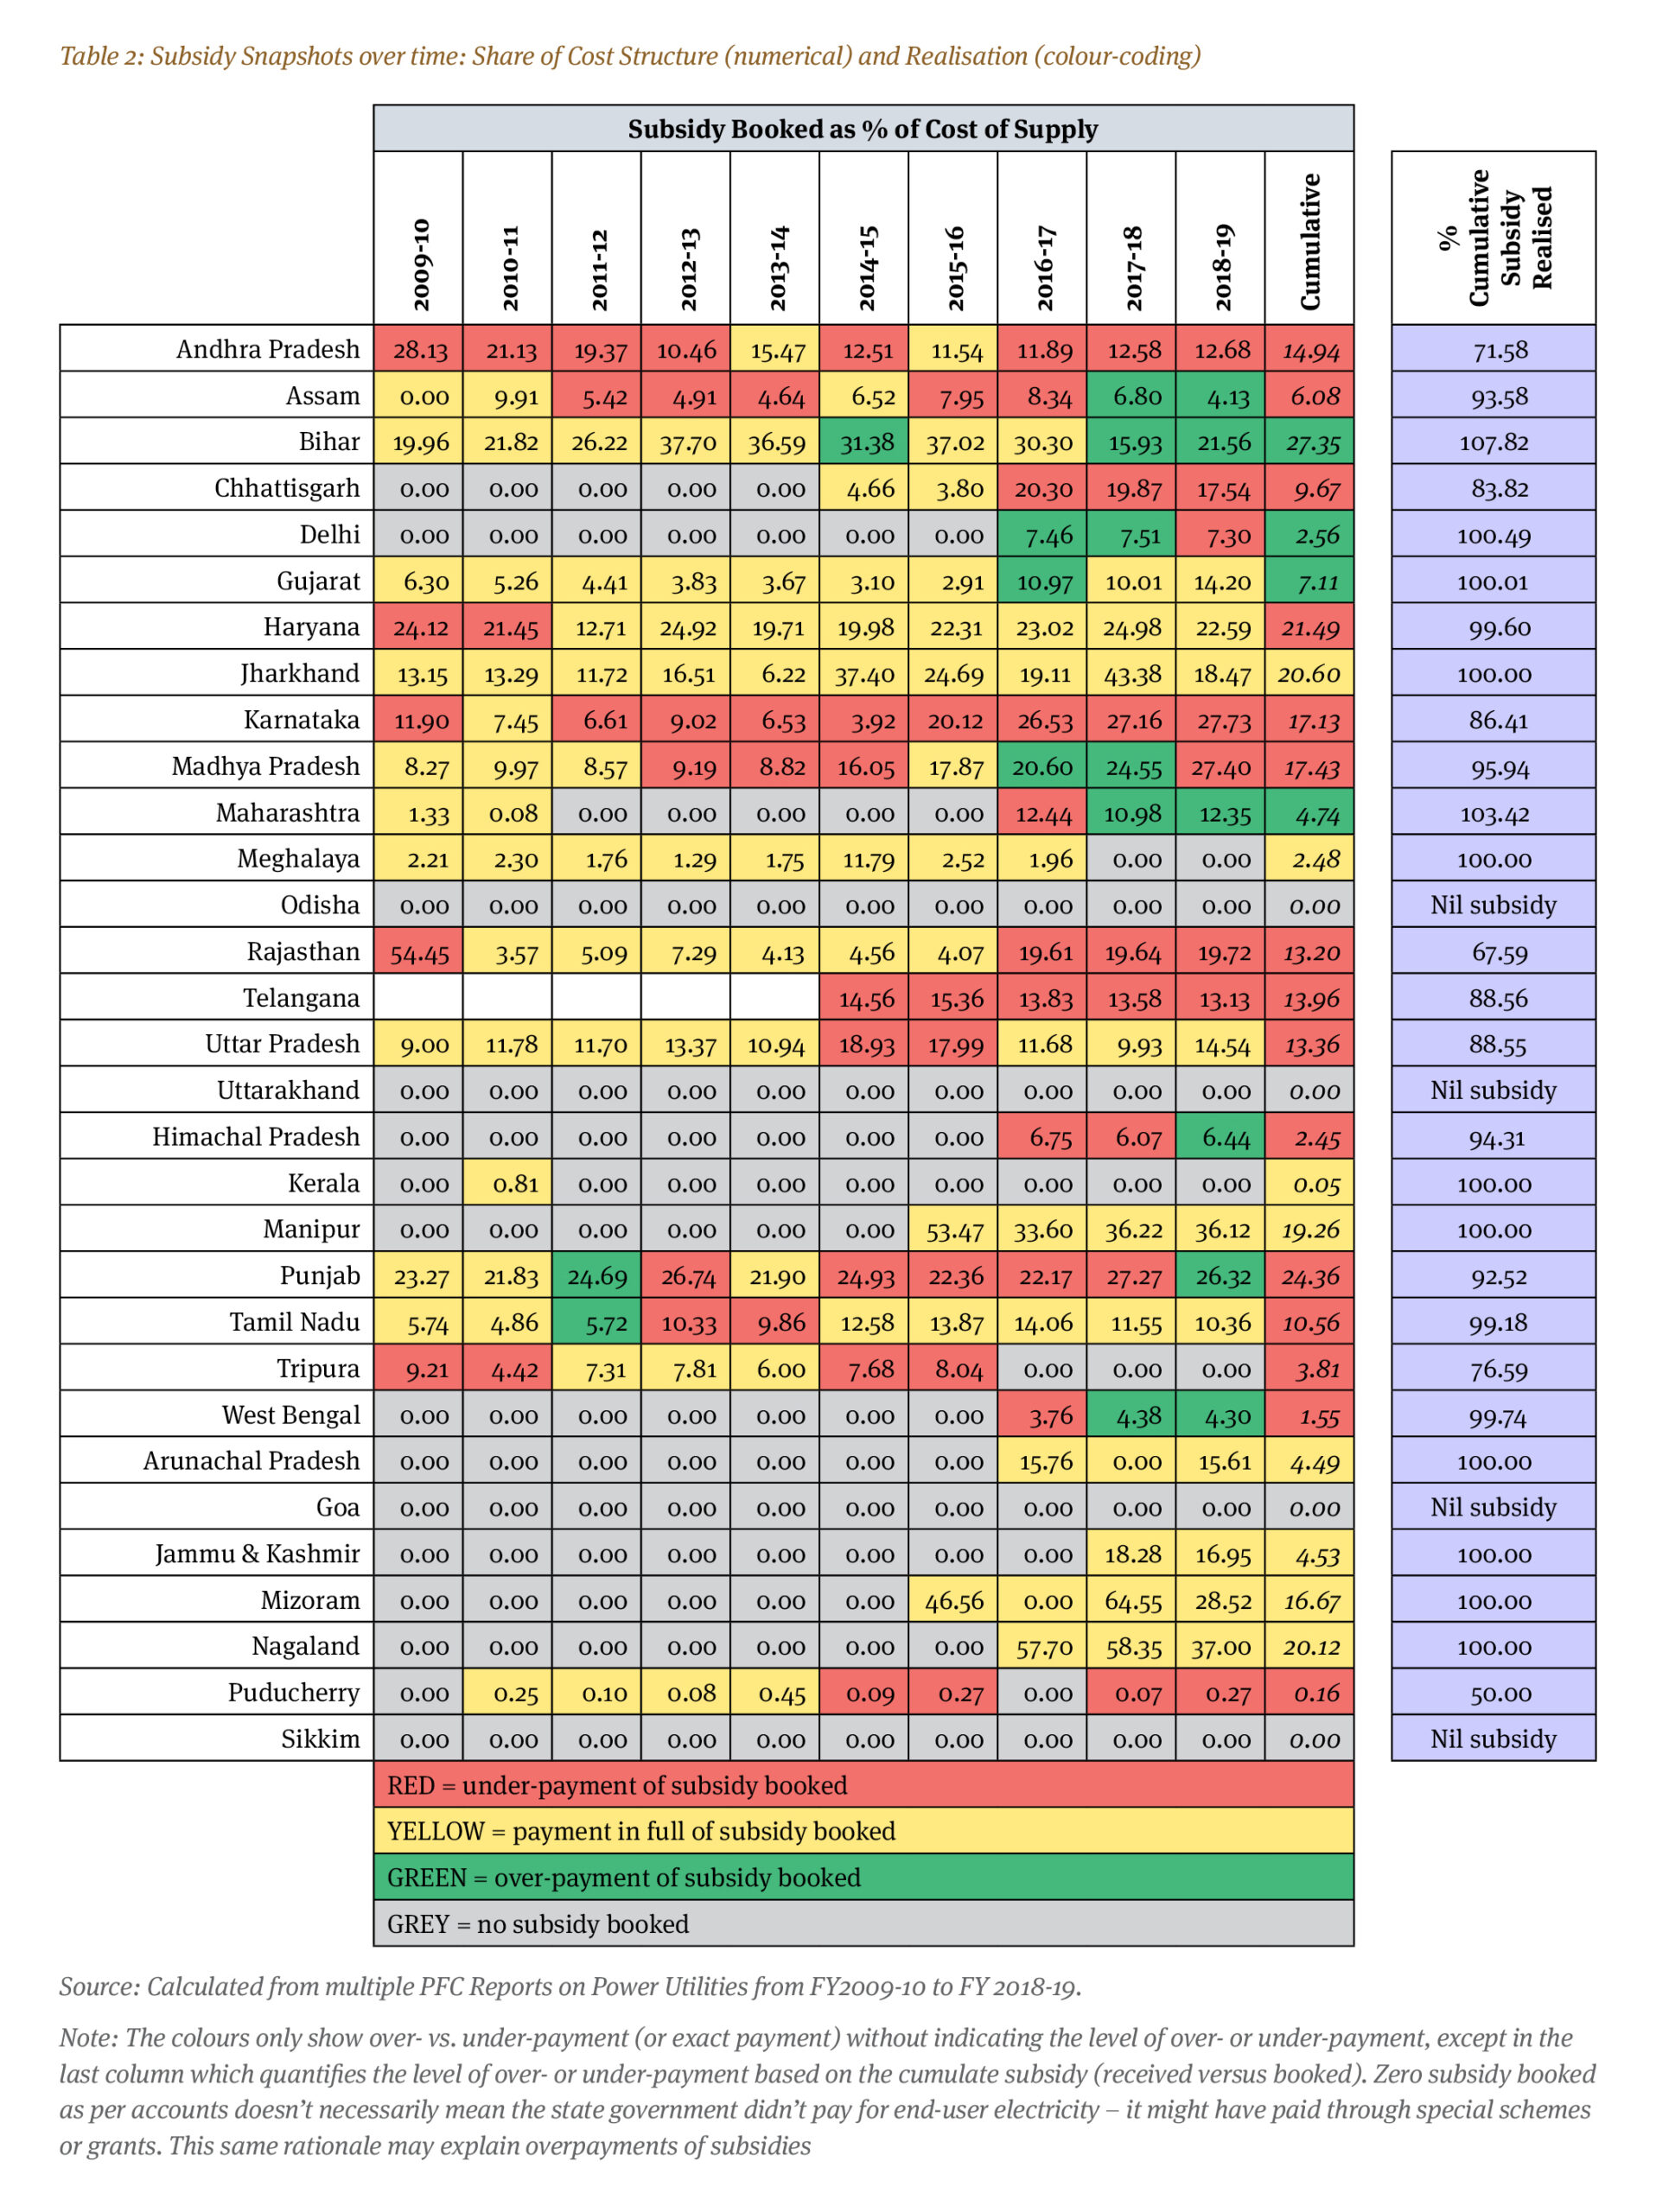
The amount of subsidy that each state wants to provide is a policy decision that in theory should not affect DisComs. However, Table 1 shows that the fraction of the cost structure meant to be covered by subsidies reached its minimum in FY 2012-13, but has since grown to about 15%. When any translation between the share of received versus booked subsidies becomes a large cash flow issue it creates problems for DisComs, even more so in aggregate over time.
More than the national unpaid subsidy, it is important to understand state-level implications. On a year-by-year basis, some states “overpay” subsidies, which, in effect, pays off prior dues (a few have overpaid in aggregate). But such overpayments don’t help other states, even though the all-India figure improves. Table 2 shows the time series of subsidies at a state level, capturing both share of subsidies booked compared to total cost structure overlaid with a colour schema showing whether that particular year’s subsidy as booked was paid in full or not (or overpaid). We can immediately see that a “modest” all-India average figure includes enormous unpaid subsidies for states like Rajasthan and Andhra Pradesh. The key point to note is these states show a combination of high subsidy share combined with low realisation of booked subsidies. In contrast, say, Haryana has much higher subsidies as share of tariffs, but it received almost all of it. Conversely, Tripura and Puducherry had poor realisation of subsidies booked, but the share of subsidies in cost of electricity was low.
It’s worth emphasising that cumulative share of subsidies booked is over 10 years, so a hypothetical state-specific 3% aggregate subsidy shortfall (product of share of subsidies times the share un-realised) is multiple times more than 3% of annual electricity costs. And when DisComs have little or no cash surplus to pay their suppliers, this can become a critical contributor to their inability to pay generators or other vendors.
3.2. Many consumers don’t pay in full, including state governments
While many diverse consumers may owe money, the single largest non-payer for consumption is the state government(s).[12] Breakdowns of dues from consumers are not declared by DisComs, but during the third quarter of FY 2019-20, press reports[13] observed pending dues from ten states (which include Maharashtra, Chhattisgarh, Kerala, Tamil Nadu, Punjab, Bihar, Haryana, UP, Telangana and Andhra Pradesh) as Rs. 37,211 crore. This figure would clearly increase when we add the all-India numbers beyond these 10 states. We don’t know if states not shown have proportional receivables from state governments for consumption, but assuming they did, extrapolating to all-India could raise the dues shown by several tens of percent.
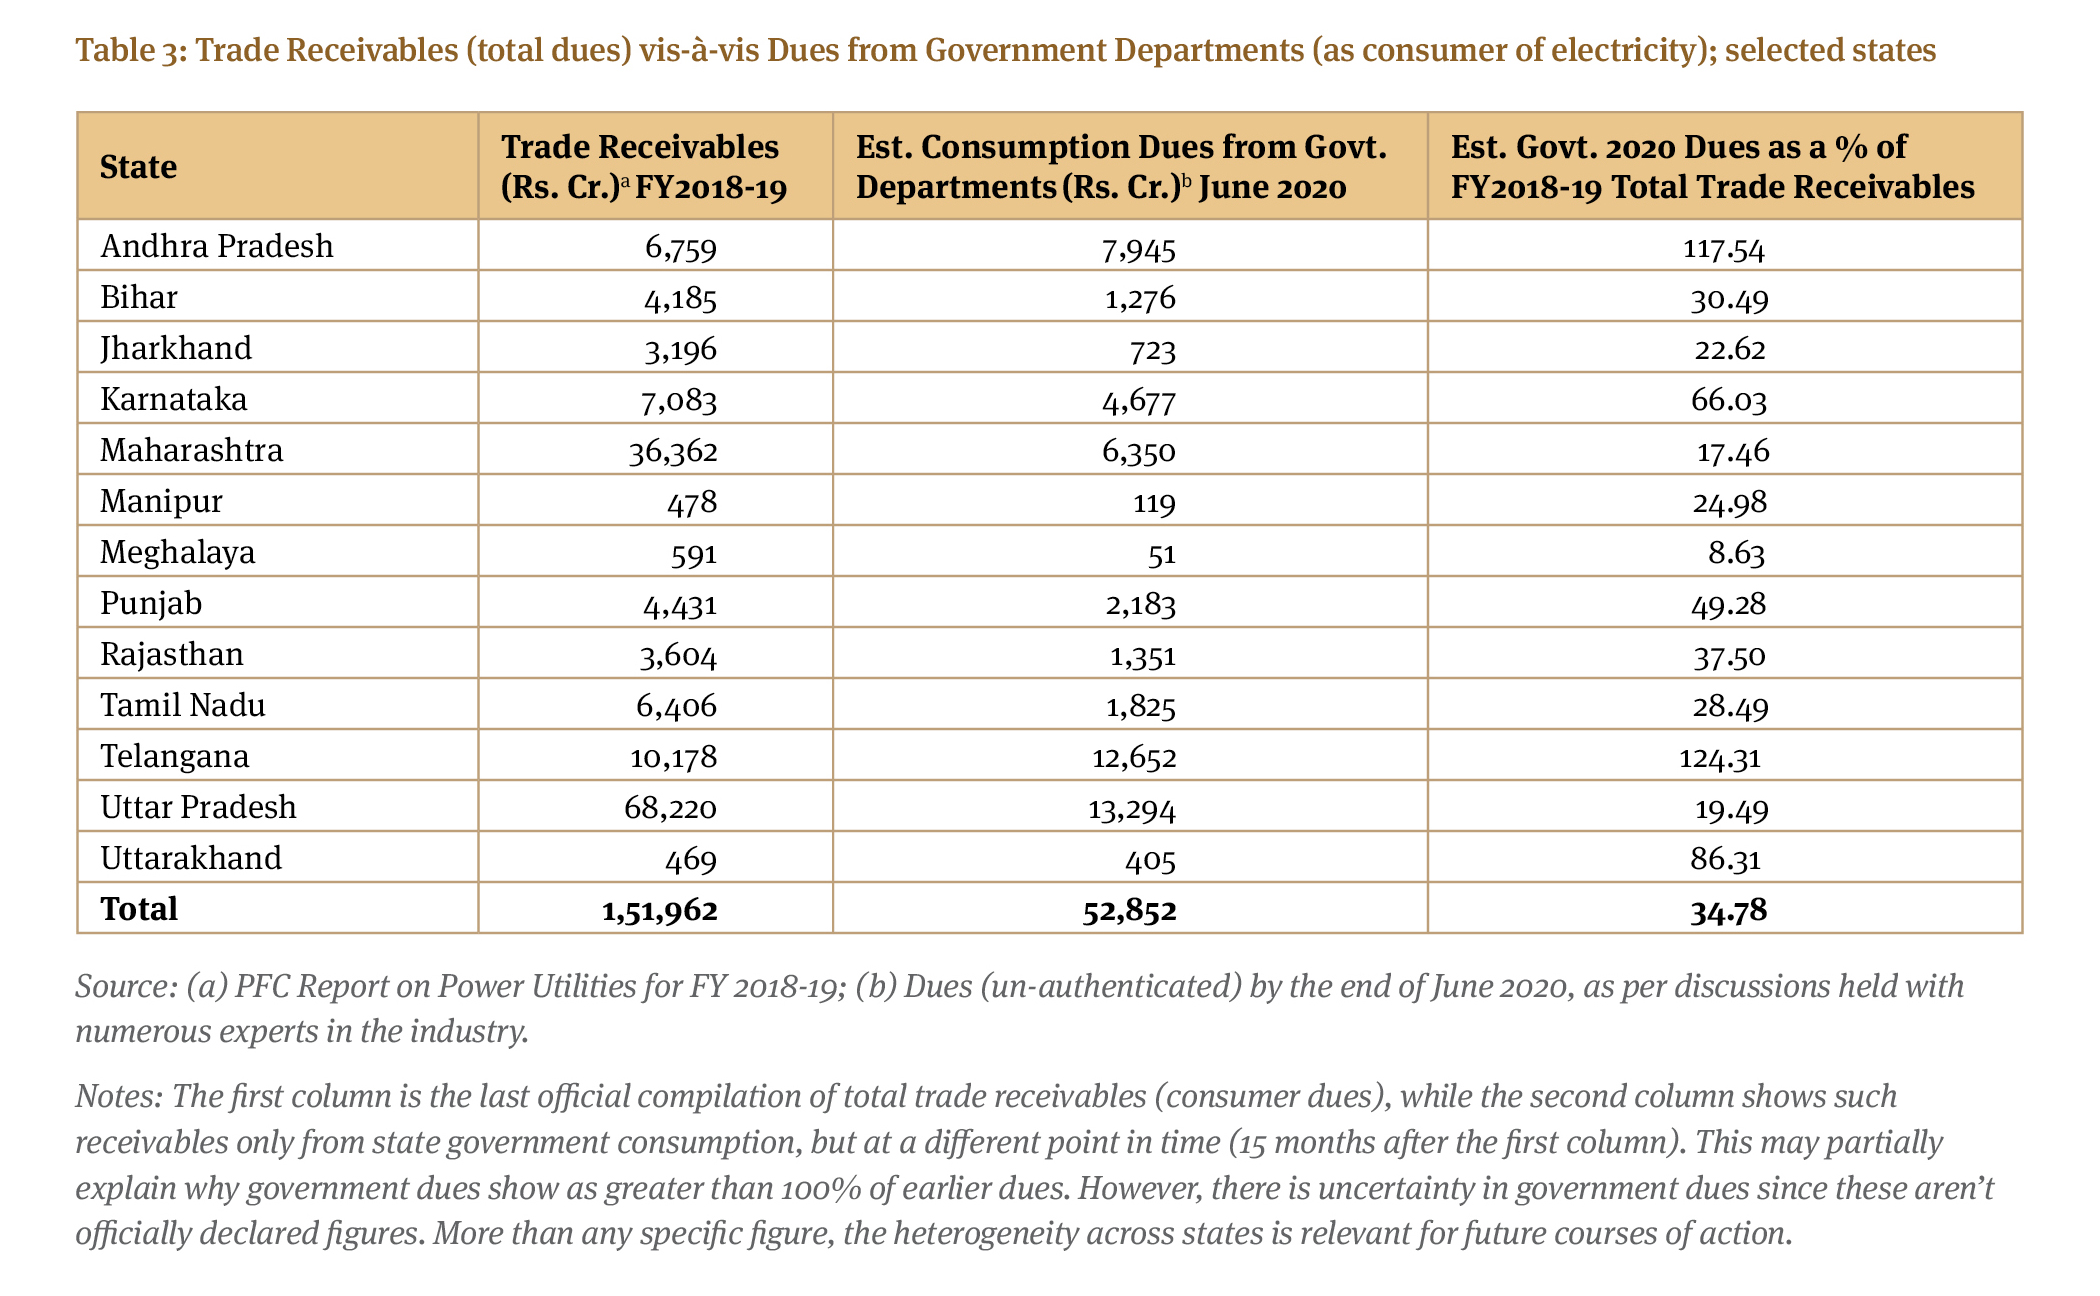
We further triangulate these numbers based on the official figure given by the Power Minister in Parliament in December, 2019,[14] which stated that the total dues/outstanding against state government departments stood at Rs 41,000 crore. Subsequent informal discussions with various experts in the industry indicate plausible outstanding unpaid consumption dues (unverified and un-authenticated) of government departments could be around Rs. 65,000 crore out of which 13 States together owe Rs. 52,852 crore to their DisComs (Table 3).
Due to these receivables, DisComs may not have any option but to borrow from banks to cover cash needs. This attracts a carrying cost, but much if not all such unplanned loans are disallowed in the tariff calculations by the Regulator. The extent to which DisComs charge interest or penalties on chronic defaulters is also unclear, since the theoretical norm is to simply shut off supply – which they are not doing for government consumers.
A summary of the income statements and sub-set of the balance sheets is given in Table 4. The lower half examines the balance-sheet side of dues (from and to Discoms) but only for short-term obligations, which means these will have cash implications for DisComs soon (technically, within one year). Long-term DisCom debt (not shown), categorised as non-current borrowings and other non-current liabilities, was Rs. 486,673 crore In FY2018-19.[15] However, the annualised implications are already captured in maturities and interest, and this paper is focused on short term cash needs, which are a driver for the “stimulus” loans.
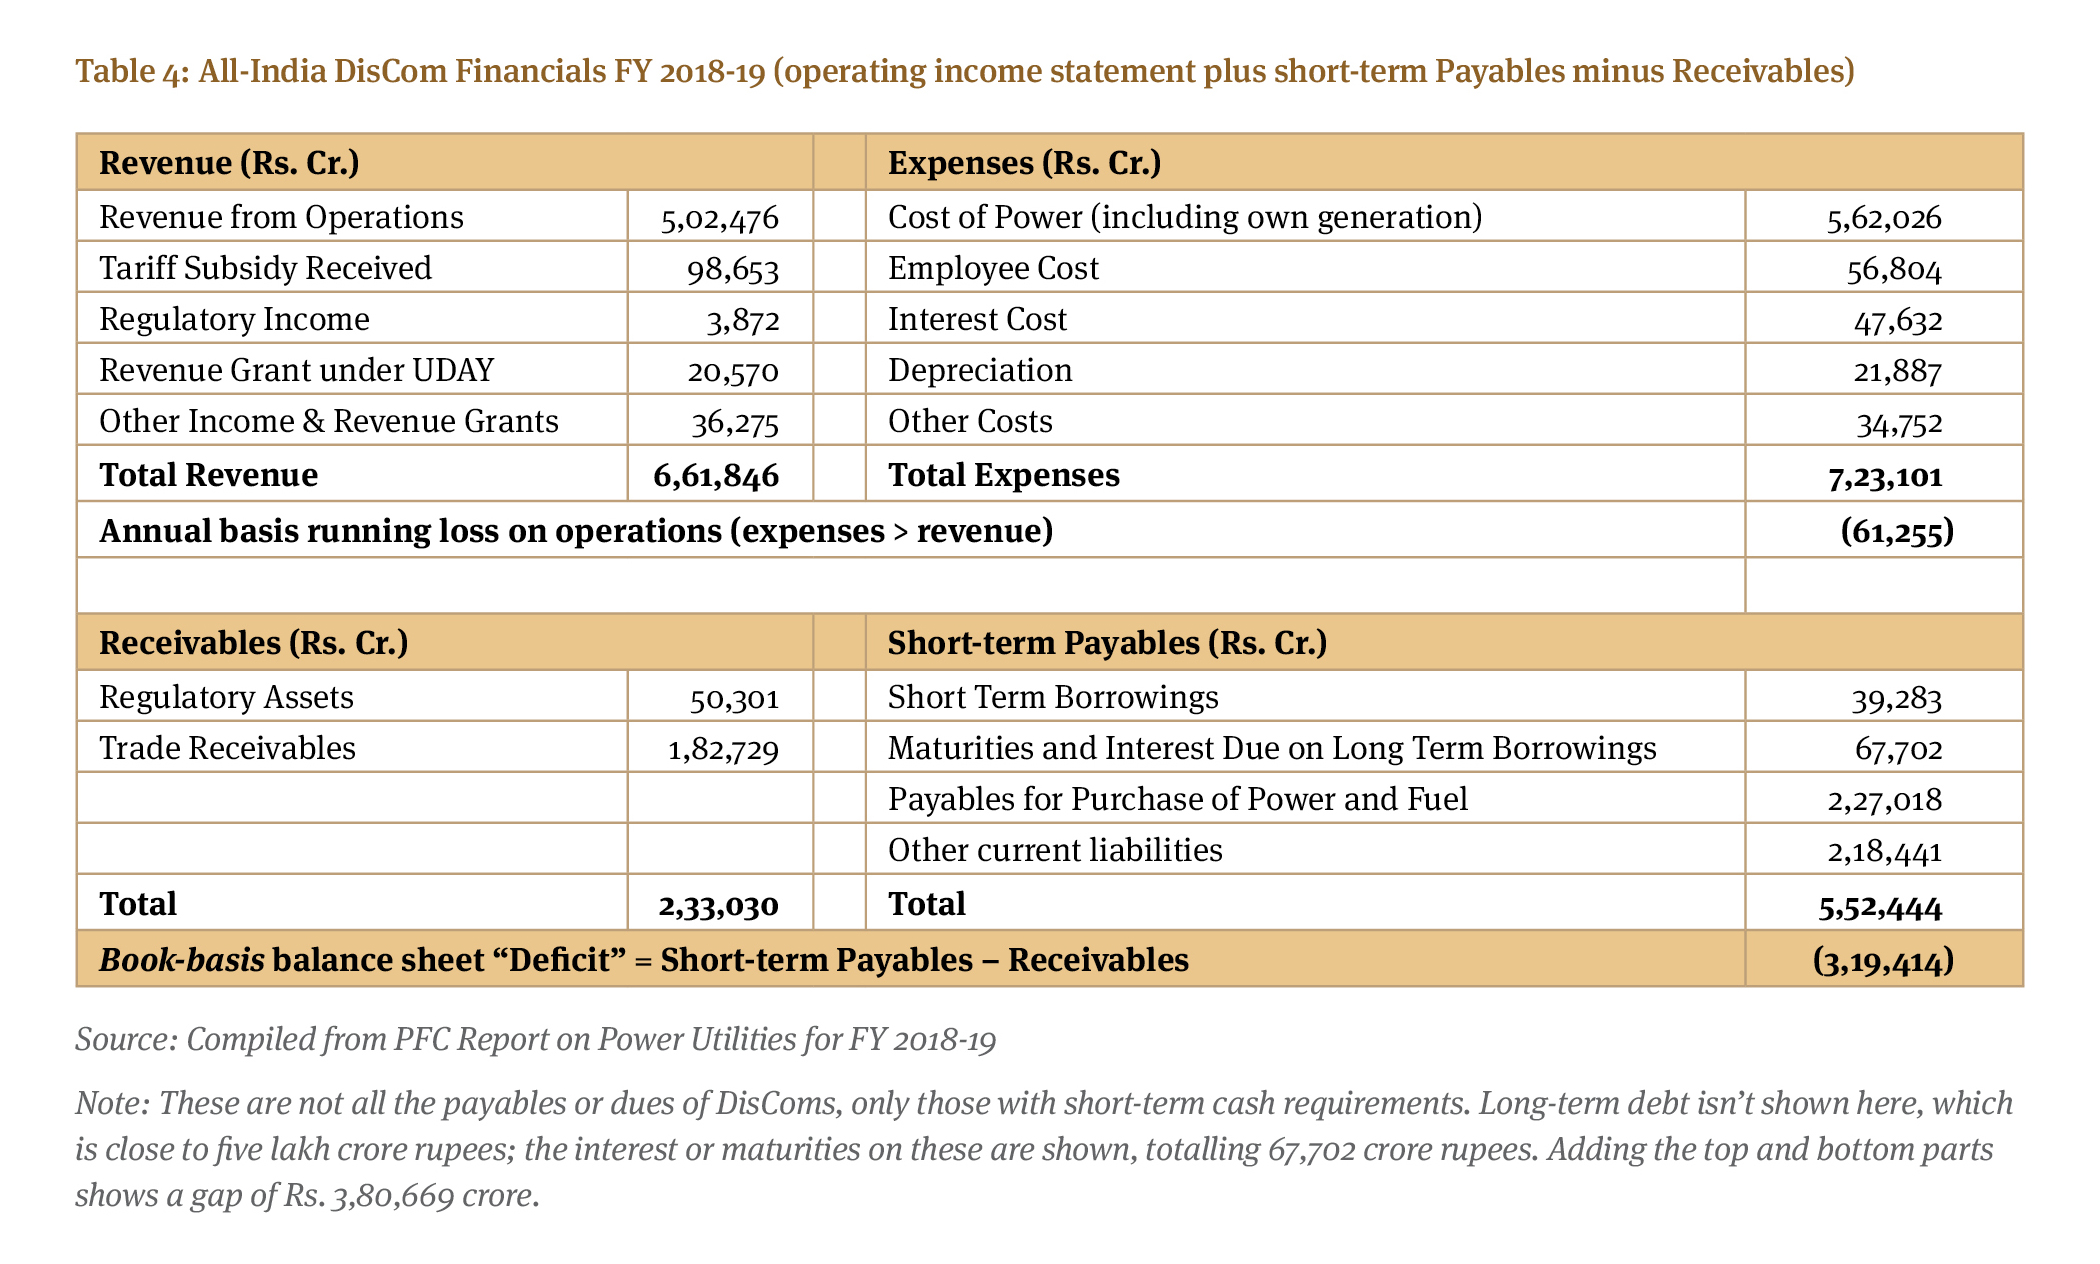
While a measurable gap of Rs. 61,255 crore is found on an annual operating basis, the DisCom balance sheet net short-term liabilities, which are due soon, even after offsetting receivables from payables, were Rs. 3,19,414 crore for FY2018-19. Adding these up shows that they need support, assuming no other restructuring, of
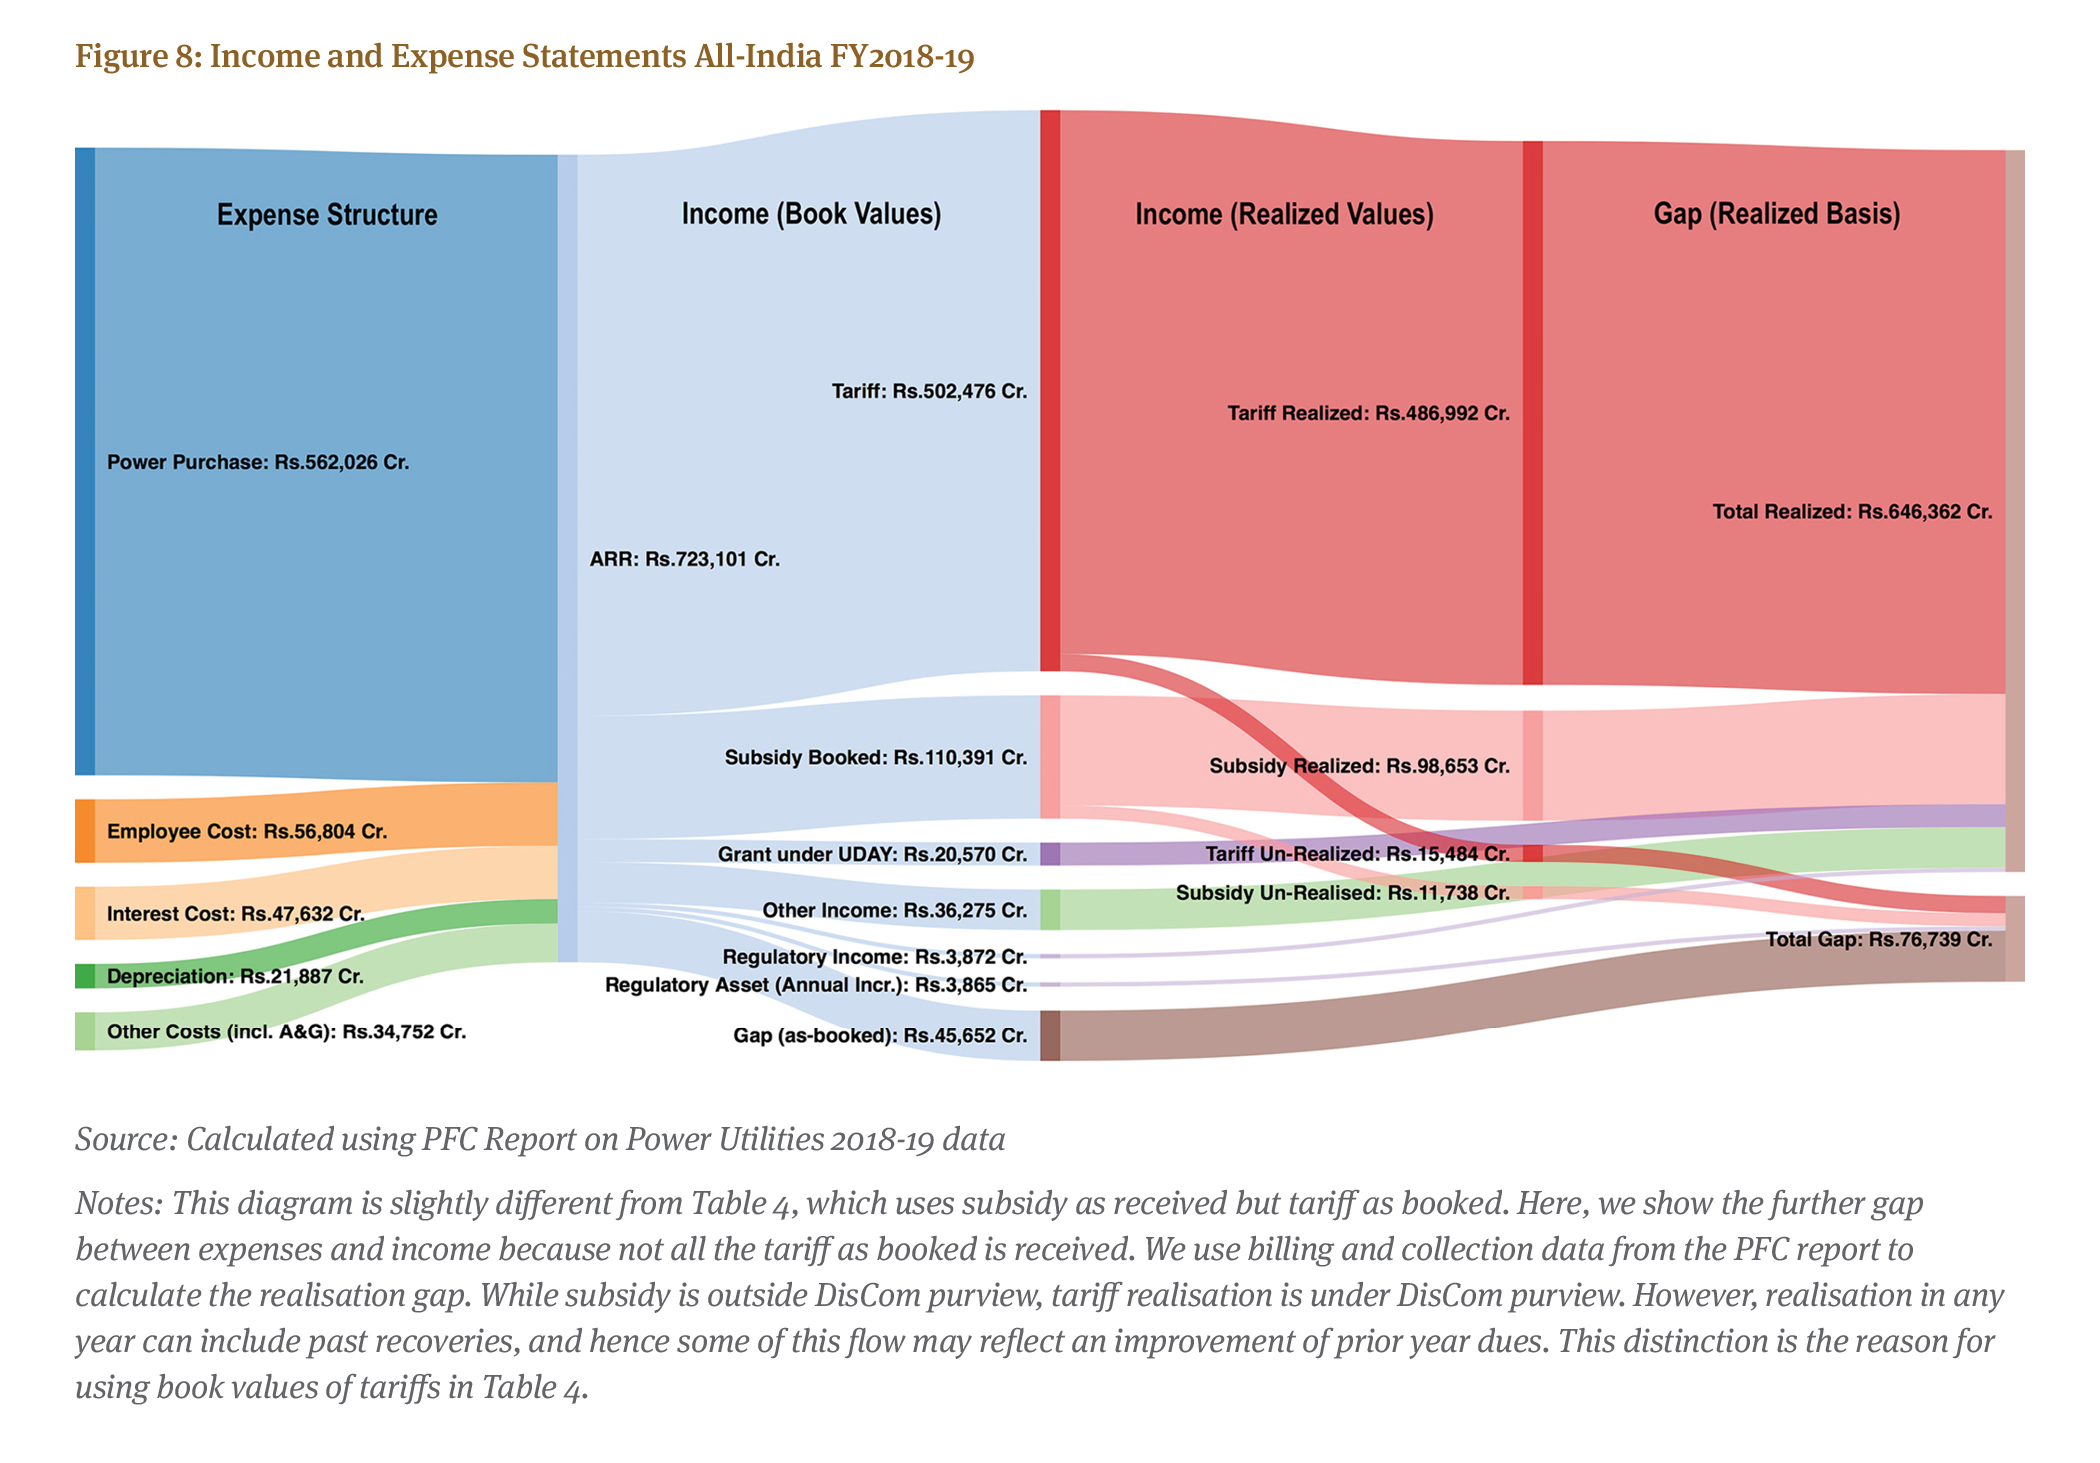
Rs. 3,80,669 crore for FY2018-19. This is after taking in all the receivables. The Appendix visualises these flows in a Sankey diagram, adding more nuance to booked versus realised income flows.
Out of all the liabilities of DisComs, dues to generators (for power purchase and fuel, the latter applicable for integrated utilities like in Tamil Nadu who also generate) are the largest immediate need. On an annual (income statement) basis, procurement of power alone cost utilities Rs. 5,62,026 crore in FY2018-19. This amount exceeds the income from operations (Table 4), and it’s only owing to grants and subsidies (the latter being the largest non-sales income for DisComs) that DisComs are expected to stay afloat.
4.1. PRAAPTI doesn’t capture all GenCos or their dues
The lower right quadrant of Table 4 shows that power purchases (and fuel) have dues in FY2018-19 of Rs. 2,27,018 crore. This is much higher than the 2020 figures discussed in the media in the order of one lakh crore, which appears to be based on PRAAPTI, the government portal meant to ensure transparency in generation billing. However, PRAAPTI only captures portal-reported dues to GenCos (Rs. 116,580 crore at the time of writing), but this understates the problem by far. Although the portal is a great start at aggregating and adding transparency, it has made no claims of being 100% comprehensive as it is primarily based on the collective effort of GenCos which report via the portal. As all GenCos aren’t on the platform (or submit all billing information, consistently), the PRAAPTI dues shown are far short of the real figure.
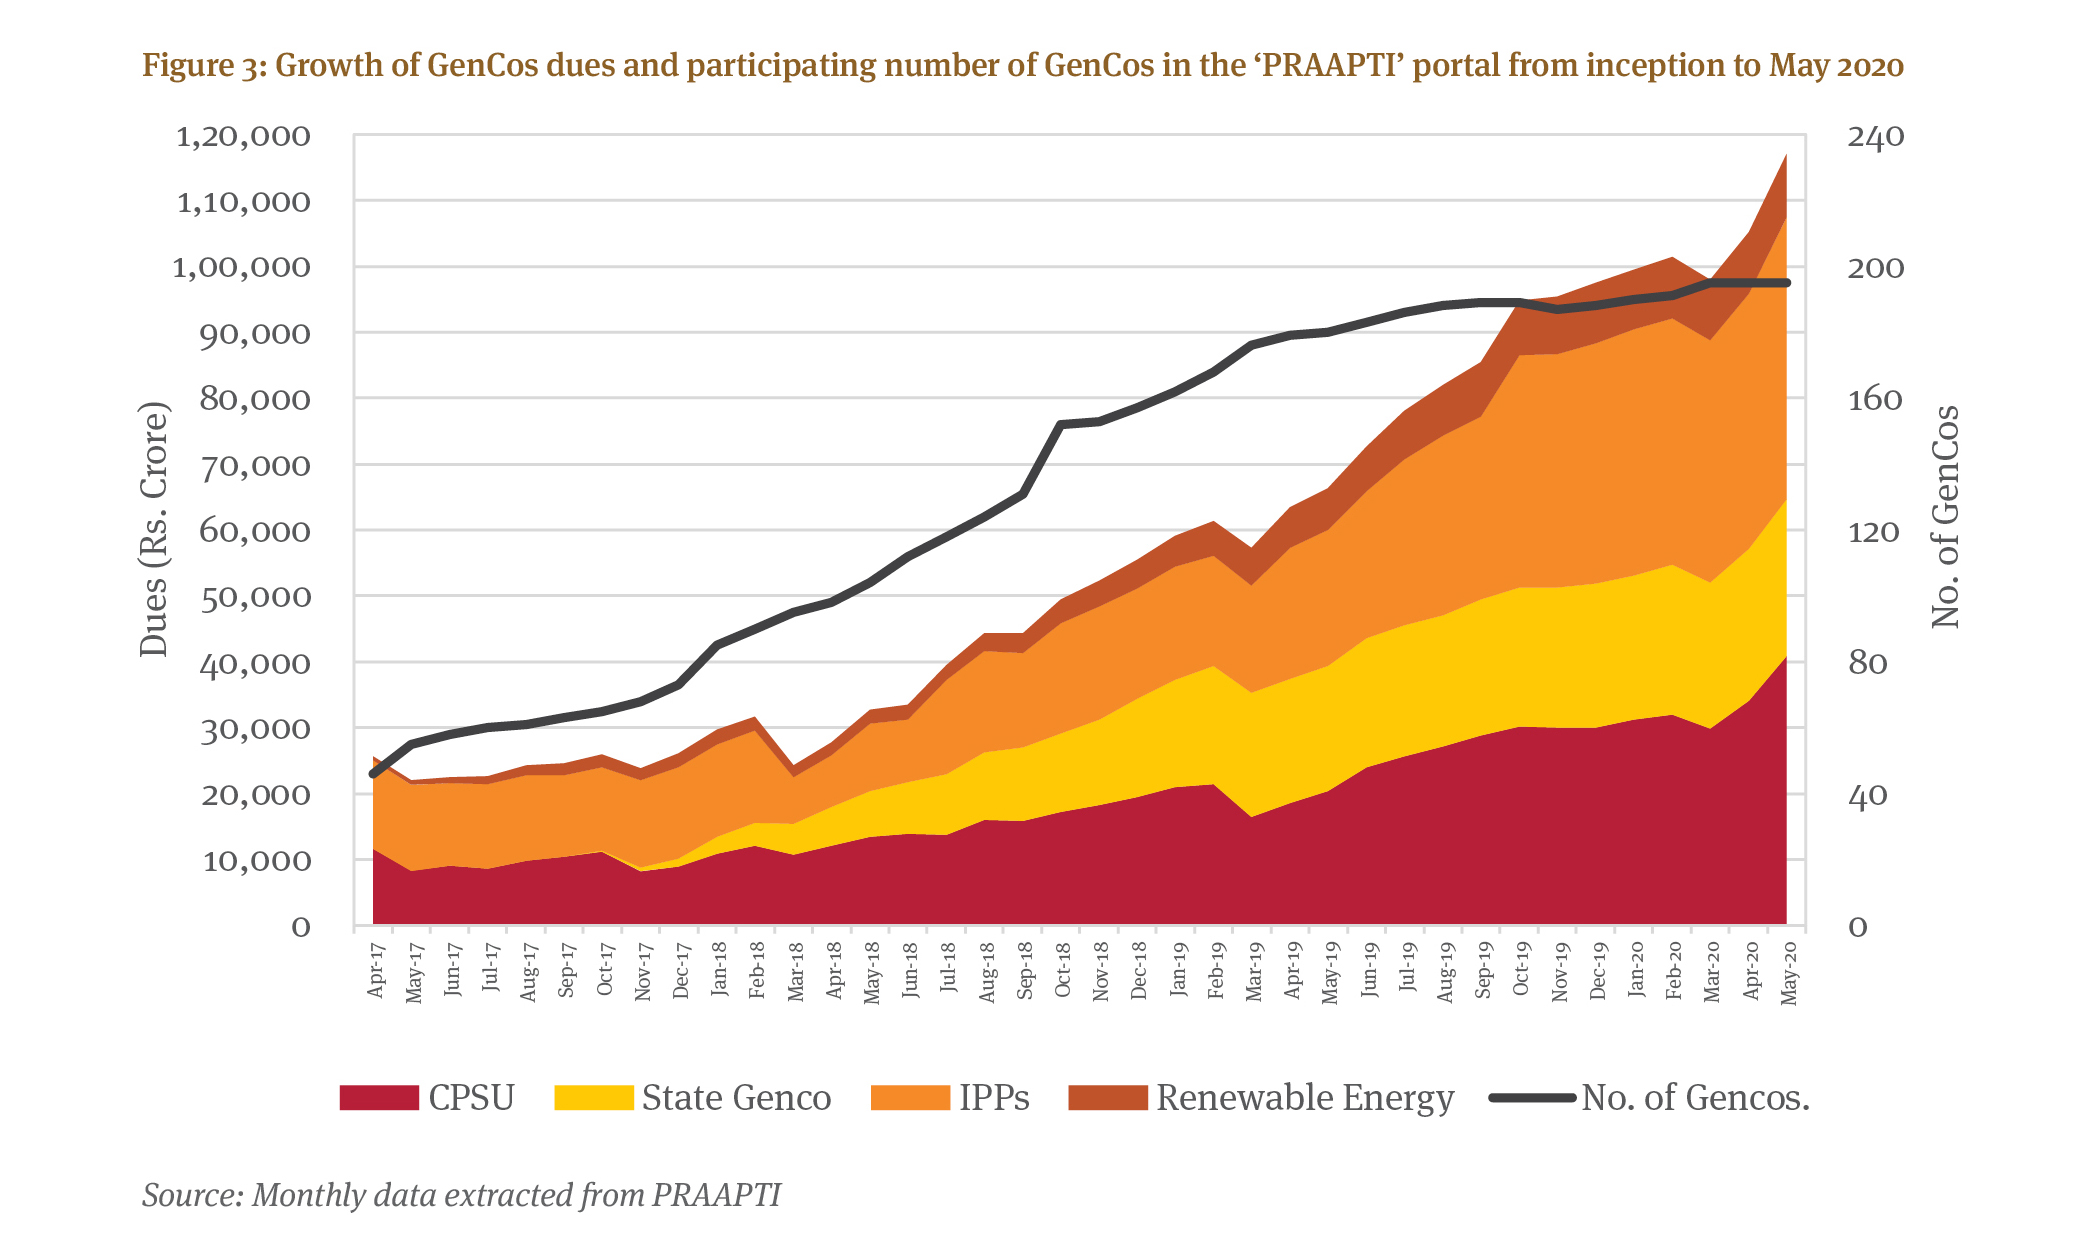
By examining the monthly trendline on PRAAPTI along with GenCo participation (Figure 3), we can see how PRAAPTI’s aggregate snapshot could be misleading. In April 2017, the portal started with 46 GenCos, and it now[16] has participation from 195 GenCos. This number remains measurably below the true number of generating companies operating in the country (approximately 548 non-RE generators[17] – Central, State and Private sectors together – and a significant number of RE generators). More than the number of participants, the majority of participating GenCos do not provide consistent and timely information. In particular, as Figure 3 shows, State
GenCos joined PRAAPTI relatively recently, and so the time series information on their dues is missing.
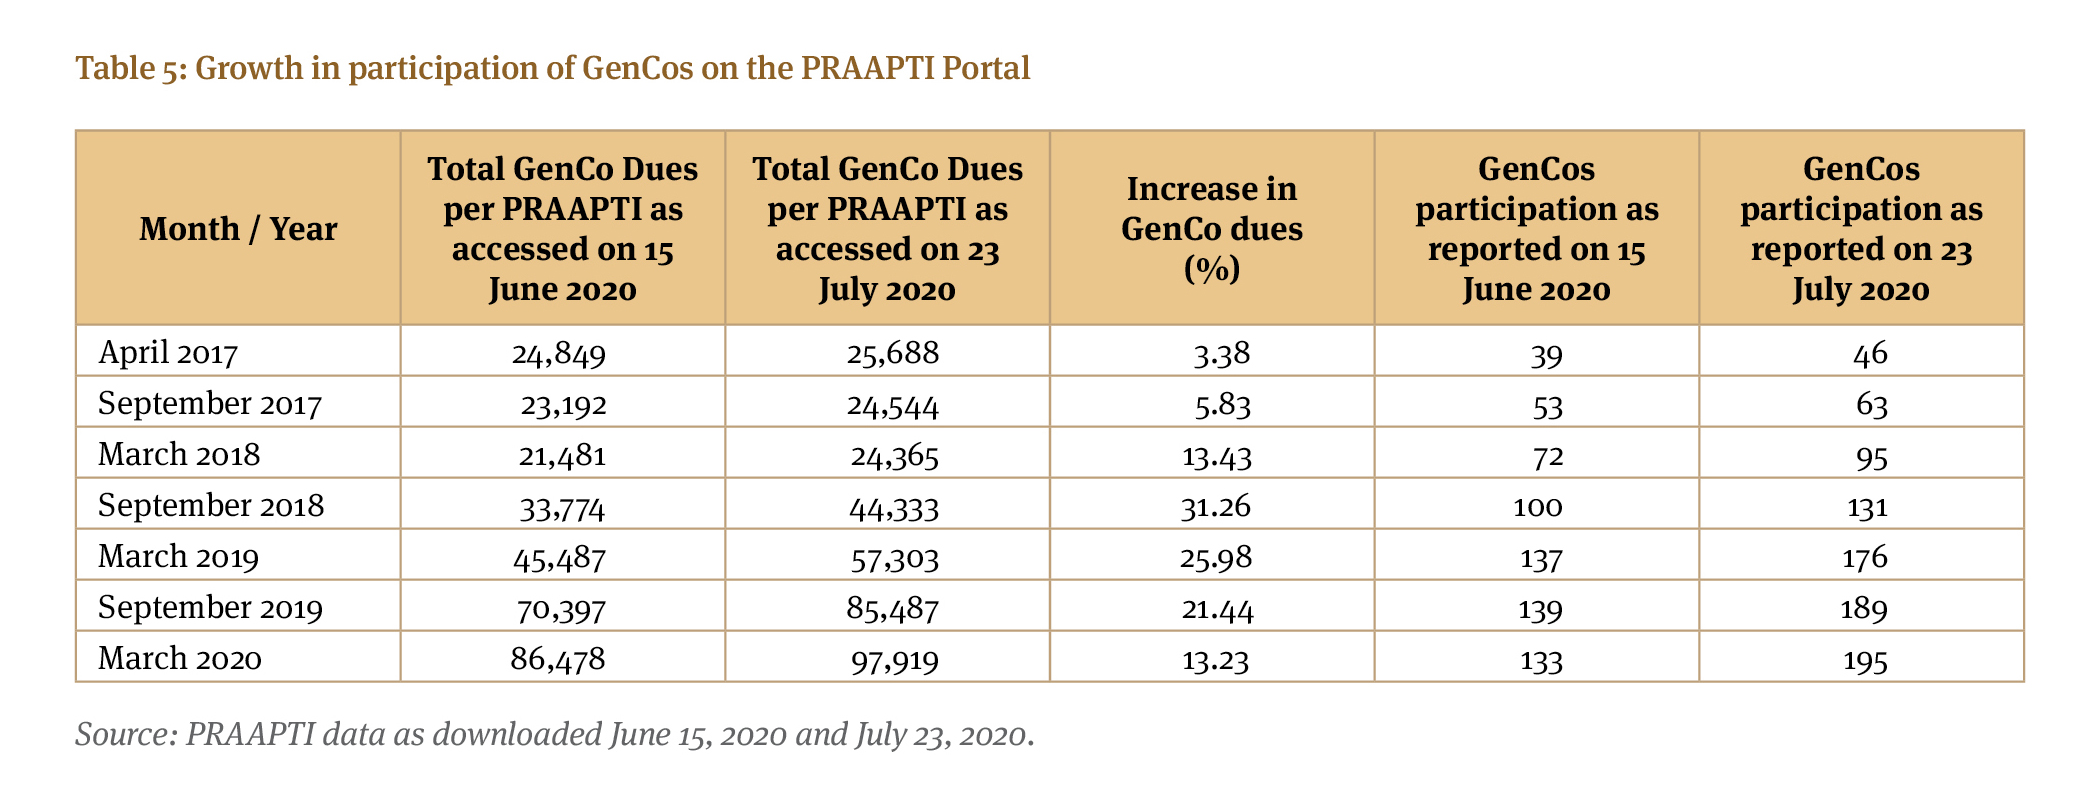
The fact that participation of GenCos is below the total number partly explains why the PRAAPTI figure for dues to generators is much below the PFC figure for the same time period. In addition, the information on PRAAPTI is constantly changing as we found a change in reported historical GenCo dues in the range of 3.38% to 31.26% just in the span of a few weeks of examining the data (Table 5). This illustrates the “non-definitive” nature of PRAAPTI data.
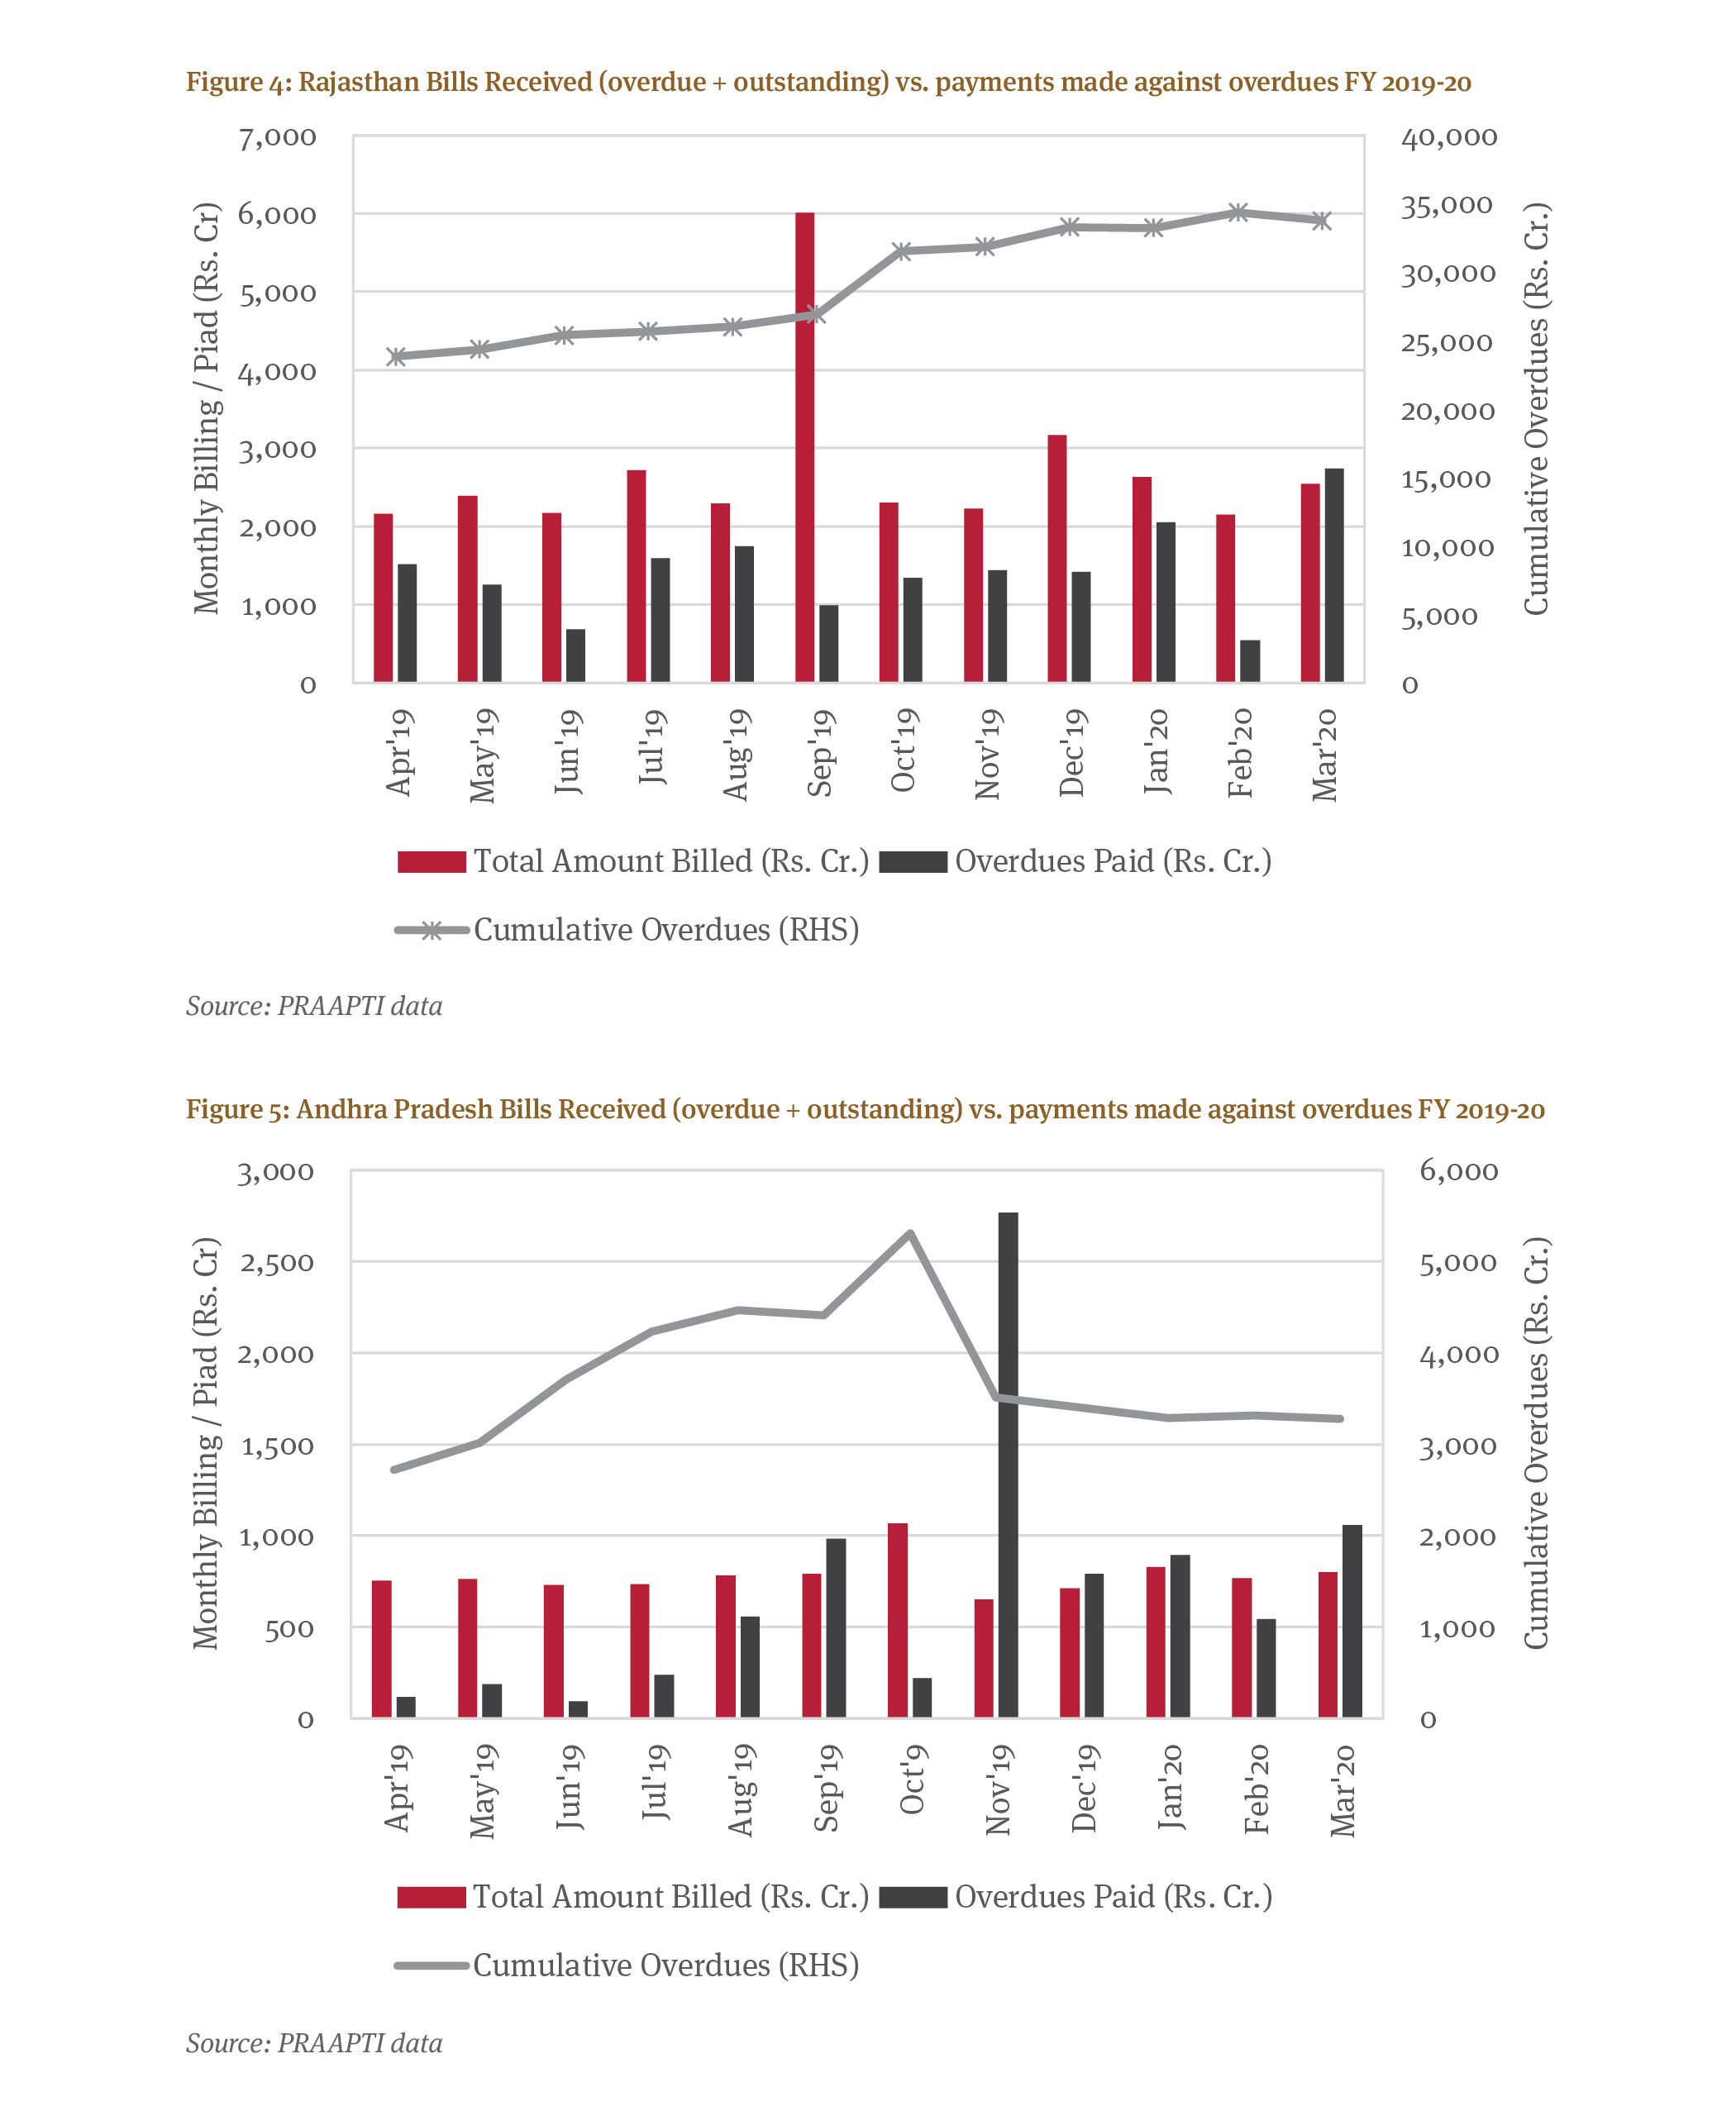
Additionally, a closer examination of PRAAPTI data indicates sudden unexplained jumps in billing and payments (Figure 4 for Rajasthan and Figure 5 for Andhra Pradesh as examples, respectively), which do not map one-is-to-one to electricity transactions by DisComs when we dig deeper into the time-series monthly data.
The billing data provided in PRAAPTI also does not indicate the break-up of dues into overdues of past period, versus the dues of current billing month, let alone late payment surcharges or affiliated charges.[18] However, it has a breakdown of payments made, whether they are for current bills or past dues. The data remain silent on occasional one-off jumps in dues, leaving them unexplained. Conversely, there are often sudden jumps in payments made, frequently including those made in March (financial year ends; see three such yearly dips in Figure 3) or UDAY-linked payments. This emphasises the need to look beyond any single month or slice, but rather at the trends.
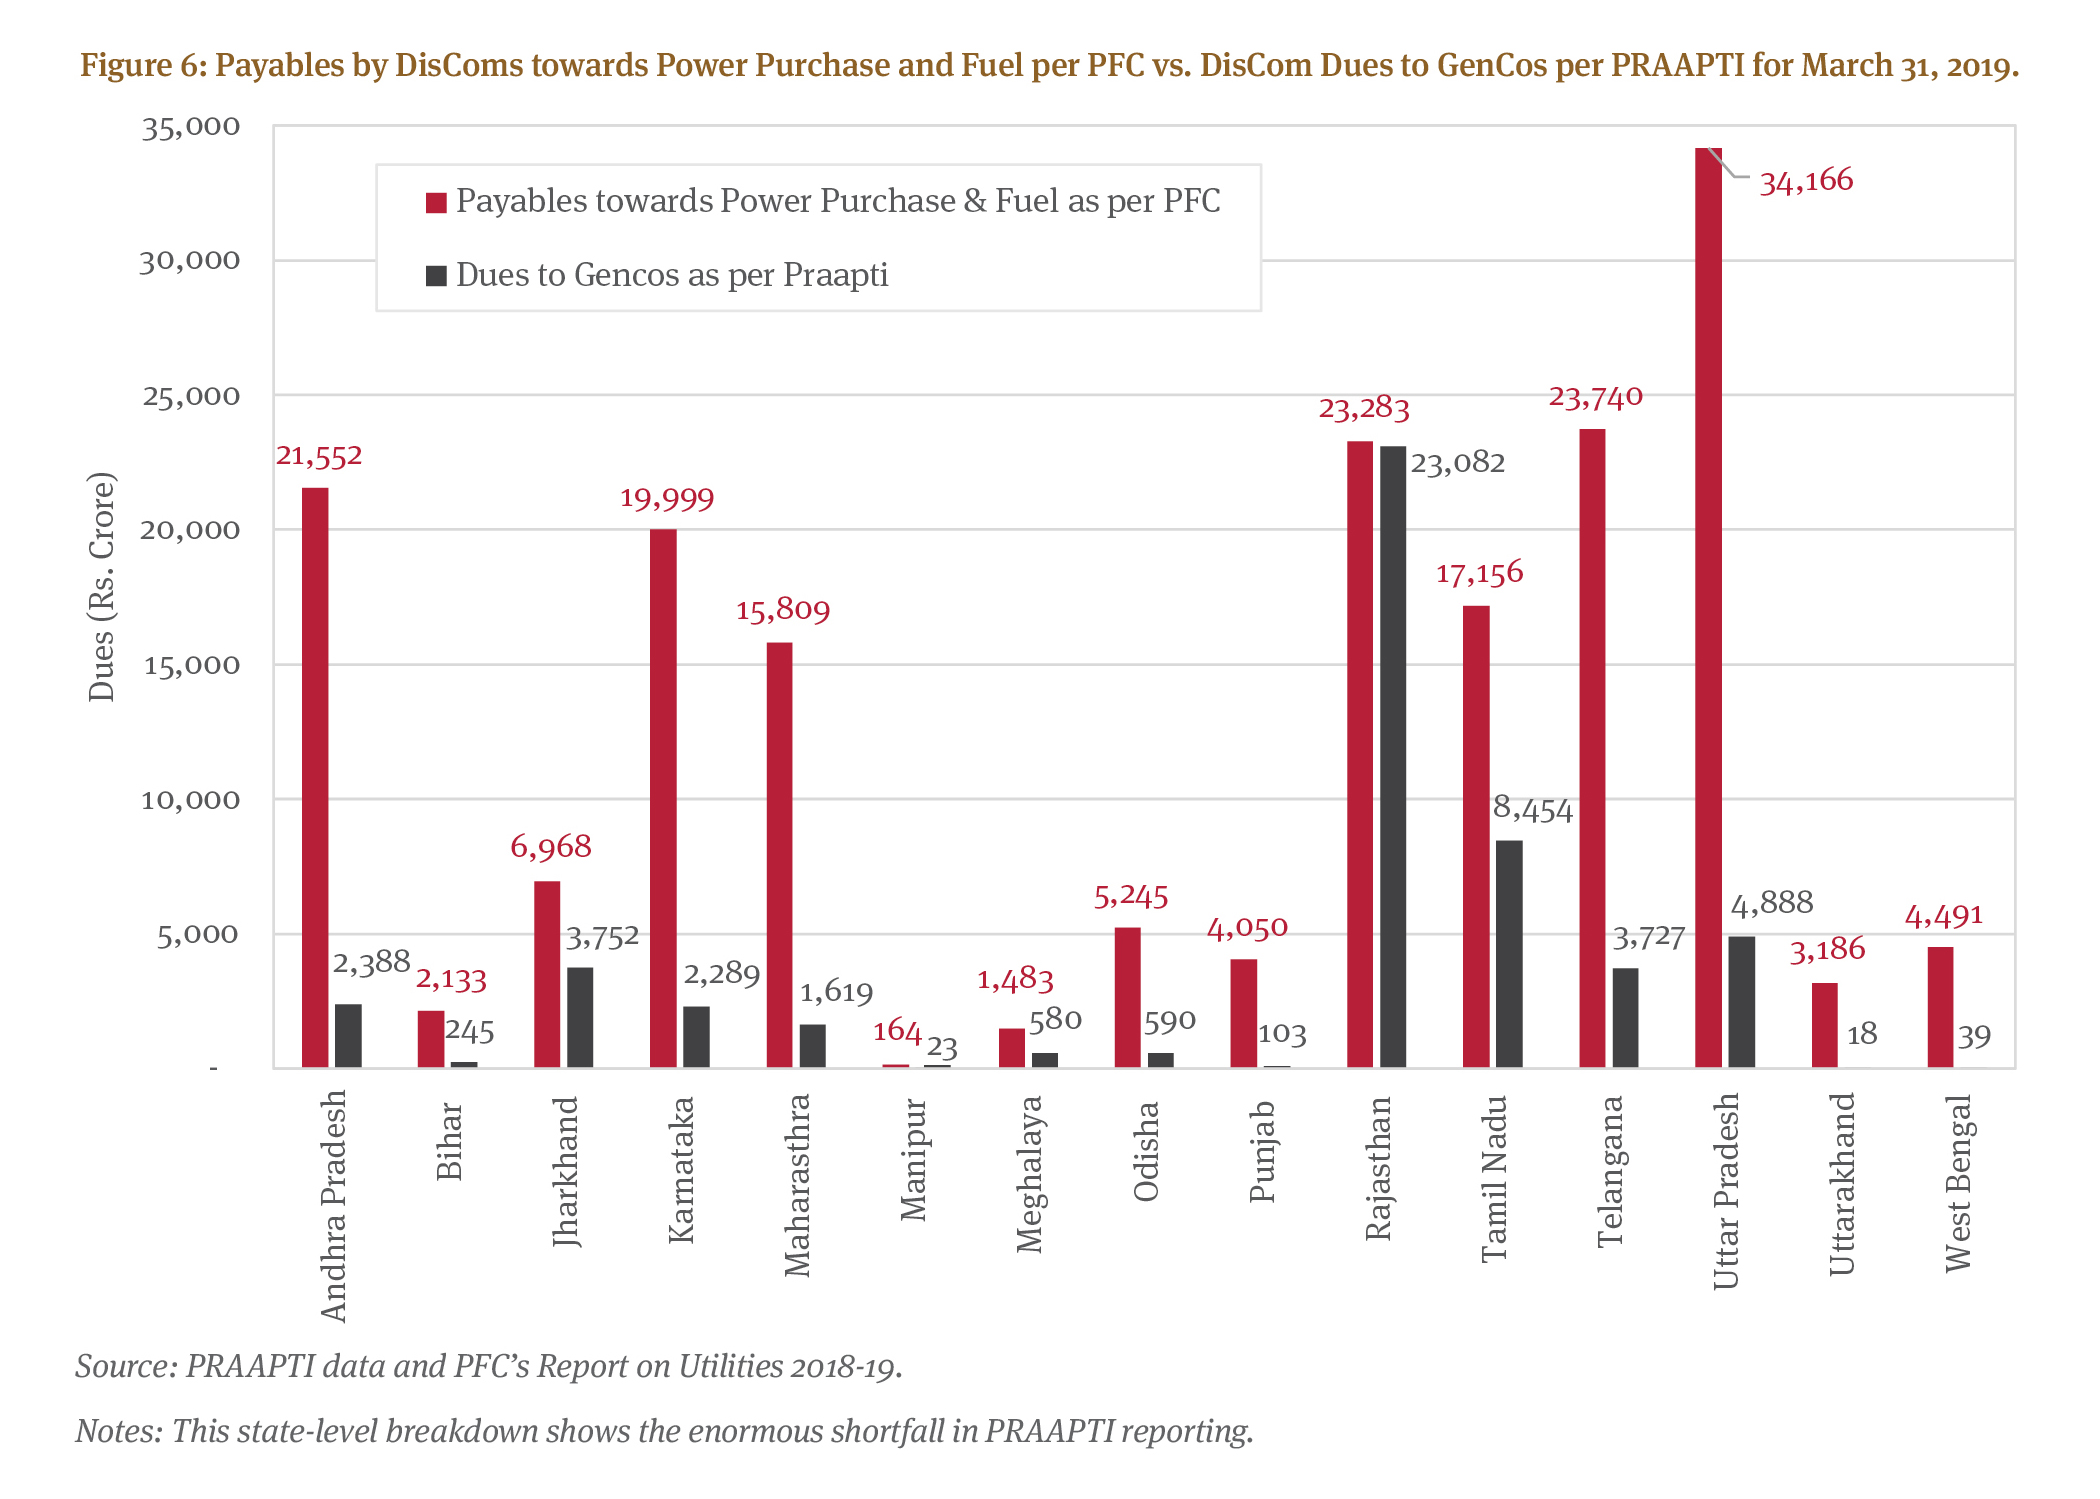
A comparison of payables towards power purchase and fuel by DisComs for FY 2018-19 (the PFC Report) with their dues to GenCos (as per the PRAAPTI portal) for the same period finds significant discrepancies. Out of fourteen chosen states, except in the case of Rajasthan, the payables under the PFC report are much higher than the payables to GenCos under PRAAPTI; even Rajasthan has a slightly lower amount due shown in PRAAPTI (Figure 6). Although the element of charges on account of fuel can create some differences, this applies more in states with integrated operations, and it certainly does not explain the huge discrepancy between the two comparable parameters. Some part of discrepancies can be attributed to ‘dues’ as per PFC, which might factor in single month billing (shown as a slice for March 2019), combining historical past dues. But even this doesn’t explain the gap – the fundamental issue is a misreading of what PRAAPTI covers.
The latest state-wise dues by the end of FY 2019-20 reported from various press reports vis-à-vis the dues to GenCos as per PRAAPTI portal also indicate large variation. The GenCo dues of States of Jharkhand, Maharashtra and Rajasthan on PRAAPTI are in excess of dues indicated in press reports. But, for Andhra Pradesh, Bihar, Karnataka, Manipur, Meghalaya, Punjab, Tamil Nadu, Telangana, Uttar Pradesh and Uttarakhand the PRAAPTI indicated dues are lower by 21%–85% compared to the information available in press reports (Table 6). While press reports are not official, they can be more up-to-date based on current information. On the other hand, sometimes they show enormous differences, for example, for Rajasthan (Table 6).
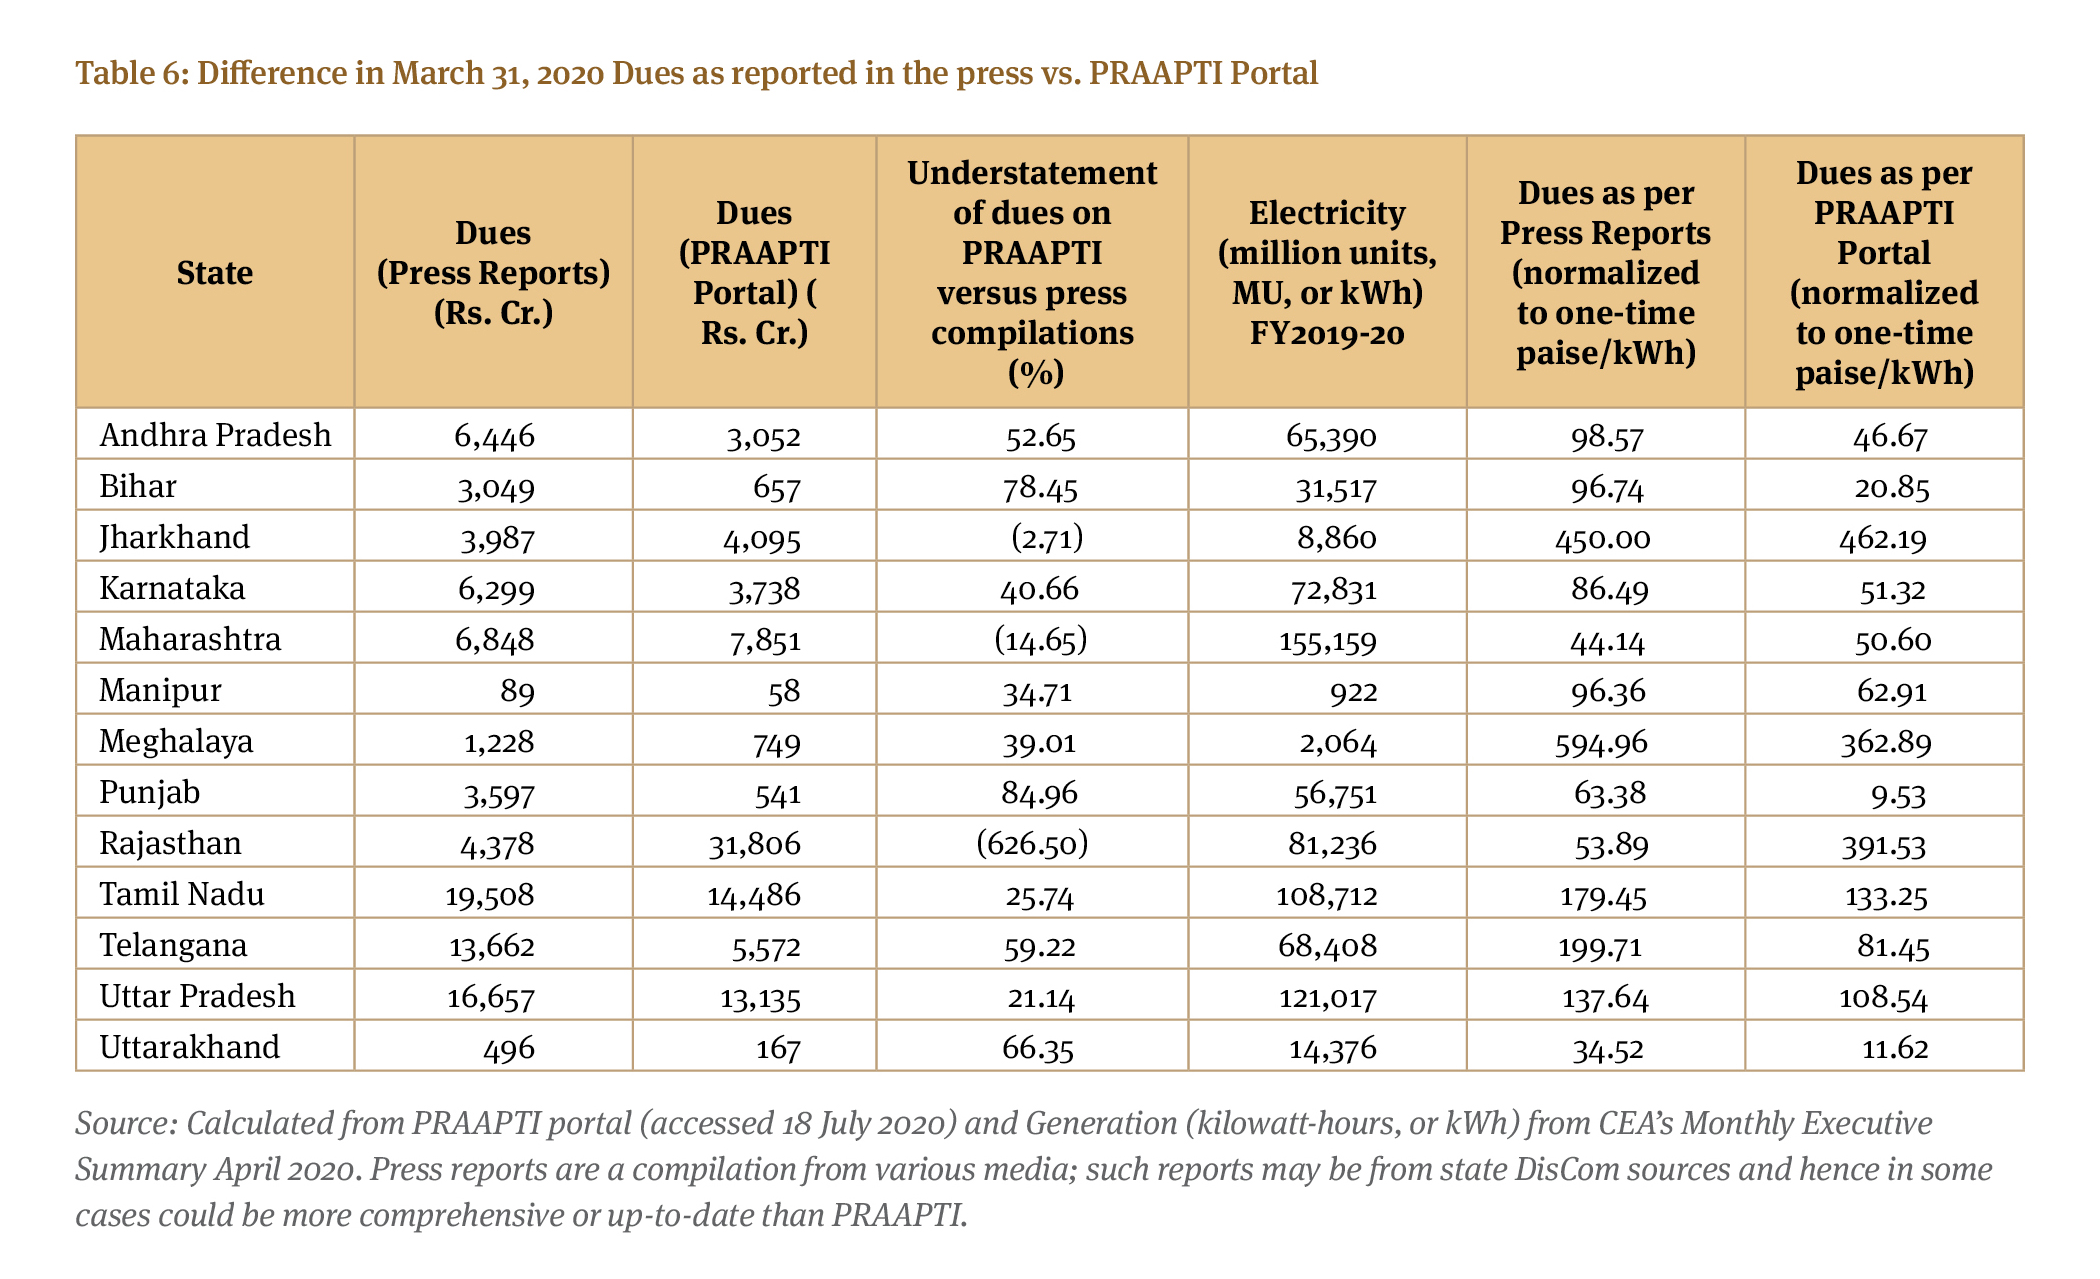
The purpose of using press reports is to get a secondary estimate of dues in 2020, for which audited or official data like from PFC’s report, are unavailable. However, the more important takeaway than specific numbers is the range and heterogeneity of dues across states. To summarise, PRAAPTI dues are a subset of generator (power procurement) dues, and generator dues are a subset of short-term liabilities. As discussed before, there are significant other short-term payables, also adding up to over three lakh crore.
4.2. Non-Genco Dues
PRAAPTI only captures dues to generators, and if dues to TransCos (which are modest compared to dues to GenCos) and other working capital requirements are also included, any loan relief calculated just on the basis of electricity procurement dues would require a further upward revision.
To summarise, PRAAPTI dues are a subset of generator (power procurement) dues, and generator dues are a subset of short-term liabilities. As discussed before, there are significant other short-term payables, also adding up to over three lakh crore.
5.1. When are they really due?
A simplified view would be to simply offset the incoming with outgoing (income statement, top of Table 4), and to do the same for dues on both sides, i.e., receivables and payables. Even for FY2018-19, and today’s picture can only be far worse, adding up the top and bottom halves of Table 4 shows a shortfall of Rs. 3,80,669 crore. This assumes that all dues and receivables are liquidated.
Even before COVID-19, it would have been unrealistic to expect dues to be liquidated overnight (or even within the year). The entire point of the government loans is to provide cash, ostensibly to pay off generators. This means the balance sheets of DisComs don’t improve at all – there’s only a formalisation of liabilities into another head, shifting payables into a loan. Depending on the terms of the loan, this provides a liquidity cushion to the DisComs, but it now creates interest obligations on the income statement, plus some portion of dues or maturity segregated in the balance sheet. A missing but useful lens becomes the cash flow statement.
Figure 1 gives us a plausible idea of what should be the “best case” scenario for winding down payables and receivables. Like AT&C losses cannot be zero, neither can days of receivables or payables. There is always an allowed and expected payment period – 45 days is a good target. Electricity consumers should normally pay within a month but let’s assume an upper bound before their supply may be disconnected. For purchasing power from suppliers, 45 days also matches CERC guidelines before which Late Payment Surcharges apply.[19] In comparison, total receivables and payables in FY 2018-19 were 135 days and 150 days, respectively. This translates to a realistic upper bound of winding down these dues by 66.7% and 70%, respectively, with the respective days of dues coming down to 45 days. Even if both sides materialise together at 45 days, that still translates to a net payable of Rs. 37,093 crore, not very different from the total difference of payables over receivables in Table 4, equivalent to zero days, of Rs. 44,289 crore.
While we appear to have an instrument to shift GenCo dues thanks to the “stimulus” loans, it is unclear that there is any similar instrument to speed up or formalise receivables owed to the DisComs. Thus, at one extreme, one could have a very slow wind down of receivables if at all. Official numbers also appear to exclude the cumulative non-payment of subsidies which don’t appear to show up as assets (perhaps because they are outside regulator purview).
It’s worth pointing out another very large segment of payables, that gets very little attention, namely Other Current Payables of Rs. 2,18,441 crore. Not only is this very large, almost as much as for sale of power, but it might also include smaller vendors providing equipment and services, including IT, meters, cabling, and transformers. It’s not clear where those are booked. For instance, BESCOM’s Annual Report 2018-19 indicates that the majority of Other Current Liabilities are for interest on Consumer Security Deposits. For all the focus on GenCo dues (including publicised via PRAAPTI) there is near zero discussion of these liabilities.
As a bounding exercise, if we consider a world where the receivables don’t materialise any time soon, then the upper-bound total loan needed, based only on FY2018-19, and including bringing down payables for power purchase to 45 days and assuming a similar multiplier for Other Current Liabilities (we don’t have the breakdown of days overdue, if at all), would then be Rs. 4,18,806 crore, which is different from Table 4 as all dues are now set at 45 days. This figure assumes that annual (ongoing) operations can’t help as they had a deficit themselves of over 60 thousand crore rupees. What any loan will do is spread out the liabilities into per-year smaller but longer-term obligations. However, in a post-COVID world, it’s unclear whether this will be enough, as annual cash flows have cratered.
In fact, if we examine a few key states, for most of them the loans announced as of the time of writing fall far short of even generator dues for FY2018-19,[20] forget total short-term obligations (Figure 7).
5.2 How much of a tariff hike does this translate to?
How manageable or impactful are these obligations, which include not only generator dues but also other payables? The last two columns of Table 6 converted the dues into Rs./kWh, based on the annual volume of electricity – a one-time equivalent of rupees per unit electricity (rather, paise/kWh). For reference, the 2018-19 all-India average electricity revenue from power sold (i.e., excluding subsidies and grants like UDAY) was 4.23 Rs./kWh.[21] We note that the implications are usually lower, but for a handful of states the one-time equivalent amount is very high.
A one-time tariff hike is impractical and it would be better to convert the dues to an annual impact based on, for example, a loan to cover expected payables. If we use a reference 10-year loan at 9.5% interest, that translates to 15.9% annual costs for ten years, based on an EMI-type annual equal repayment schedule. Thus, a theoretical one-time one rupee per kWh payable becomes a 10-year tariff hike of 16 paise. In reality the denominator will rise as demand grows so the effective impact would be lower. However, it’s evident that for some states, especially Jharkhand, Rajasthan and Meghalaya, the impact of these generator dues is still dramatic (last columns of Table 6), even after multiplying those numbers by 15.9%. This is one reason headline figures with total dues for a state are misleading – large states like UP and Tamil Nadu will always have larger dues, and normalisation is important.
It’s possible to put these figures in the context of DisCom losses, which are on a regulated (book value) basis, and consequently do not factor in dues (or receivables). PFC’s 2018-19 Report shows a gross input energy of 11,87,830 Million Units[22] (MU) of all distribution utilities in aggregate, which means it was purchased from suppliers, in 2018-19. For this power, they officially suffered a loss (with Tariff Subsidy Received but excluding Regulatory Income and UDAY Grant) of Rs. 85,803 crore, which translates into 72 paise losses per unit incoming; official loss numbers are lower as they factor in grants.
In contrast, if we calculate DisCom financial losses on the basis of units sold, which would then add distribution losses, then the denominator would fall to 891,109 Million Units sold, translating to losses of 96 paise/kWh. For the same year, the payables only towards power purchase as per PFC Report alone stood at Rs. 227,018 crore which converts to an equivalent one-time generator dues burden of 2.54 Rs./kWh of sales. Converting this to a 10-year payment (at 15.9% annually) means a tariff hike of 0.41 Rs./kWh overall. Adding other dues beyond those to generators makes this proportionally higher, almost double, even after adjusting the days payable to 45 days, instead of full liquidation (which corresponds to zero days). Thus, paying off the dues means the equivalent of doubling aggregate DisCom losses, unless one has a tariff hike (or external grant, which is difficult in these challenging times).
Importantly, we are not suggesting an across-the-board tariff hike to liquidate the dues as that would burden other (future) consumers for the failures of selected consumers and state governments – we are only indicating the scale of the problem. On the other hand, it is not possible to hold prior customers accountable, who should have borne the subsidy hike but did not.
Clearly, minimising any loan required means taking in all the receivables possible. But herein lie two problems. First, the inability to collect certain receivables pre-COVID, raises a question whether they can be paid down at all, let alone soon, in today’s environment. Perhaps a third of trade receivables are non-payments by government consumers. Second is the unique case of Regulatory Assets. [23] While they are listed as a receivable (see Table 4) and hence an asset, these actually require a tariff hike to be drawn down. This is because Regulatory Assets, by definition, represent a Regulator-ordained deferred increase in tariff. In contrast, when other receivables are taken in, it reduces any tariff increase required to liquidate dues.
Assuming that the Regulatory Assets are similarly liquidated over 10 years, and have a carrying cost of only 9.5% (which is much lower than what Regulators allow today), FY2018-19’s Rs. 50,301 crore Regulatory Assets translate to a 9 paise/kWh hike for these 10 years. Just like with subsidy (non)payments, this all-India average cost of liquidating Regulatory Assets has enormous heterogeneity across states. In fact, for 2018-19, just four states (Delhi, Maharashtra, West Bengal, and Karnataka) had all the Regulatory Assets between them![24] Thus, their deferred tariff hike is many times the 9 paise/kWh all-India average figure.
6.1. “Muddling along” may have worked…until COVID-19
As highlighted before, the near-term cash requirements of DisComs are measured in the multiple lakhs of crore of rupees, and “stimulus” loans only scratch the surface of the problem. The ostensible driver, payments to generators, in itself is about double the figure widely discussed. But before examining possible implications and solutions, it’s important to understand, ‘How did things get so bad?’
This problem didn’t happen overnight and has been in the making for years. The earlier solution, rather, equilibrium, was one of “muddling along”, where all sides delayed payments, and even generators have outstanding dues to their own suppliers. Such a game of musical chairs can’t end well, especially given COVID-19, which means the music has stopped. If FY2019-20 was more of the same (a steady but mild deterioration along historical trends), then FY2020-21, post-COVID-19 will be dramatically worse when it comes to DisCom revenues as well as state finances.
Up until now, rising volumes combined with rising prices were enough to keep a semblance of liquidity coverage, without fixing the solvency problem. Stated another way, we need to break the cycle where growing future revenues are needed to pay off the past. This is a trap similar to one faced by many builders in real-estate, where funds are required from pre-launch sales of new projects to pay off the costs of older projects. While it would take more than a balance-sheet level analysis, a possible analogy is where DisComs receive grants from the central government for projects, but don’t pay their vendors and non-generation suppliers on time.
A separate study (forthcoming) analyses whether another game is being played, where income statement losses are masked through balance sheet deteriorations. If a DisCom was not allowed to lose equity value, then operating losses would be even higher, or the state would have to chip in periodically. As we have seen, DisComs have taken a pseudo-“loan” by racking up large payables. In between FY2009-10 and FY2018-19, the payables for power grew at a CAGR of 18.20%, while total cost structure grew only 12.38% CAGR (and revenues lag the cost structure slightly).
This cannot continue, and regulators must clamp down on this practice that shifts the burden instead of solving the problem. An example of such a hidden loan comes from Other Current Liabilities, which have shown growth from Rs. 1,53,943 crore on March 31, 2017 to Rs. 2,18,441 crore in just two years, resulting in a CAGR of 19.1%. If some of these are vendors, don’t they have any recourse? While terms of contracts aren’t public, and it is unclear which heading these fall under, anecdotal discussions with suppliers indicate payments are perpetually delayed.[25]
In fact, generators are actually better off than many other stakeholders who owed money. For many power purchases, DisComs are liable to pay a late payment surcharge (LPSC) for non-payments to select GenCos (those with a PPA), and must meet their working capital requirements, which sometimes necessitates loans.[26] This is missing from many approved regulatory rate bases. As Footnote 20 pointed out, even after the reduction in LPSC after COVID-19 for tariffs under CERC purview, these charges are higher than loans. In that sense, isn’t formalisation of the dues via loans a good thing? In practice, GenCos are often willing to reach a settlement where they waive some or all the LPSC in return for getting paid sooner. Such adjustments are distinct from possible waivers or bailouts, which further disincentivise good behaviour, and represent moral hazard risk.
A macro-level look at the sectoral chain means dues to GenCos could lead to defaults on bank loans. After the RBI’s 2018 circulars, lenders have less leeway to negotiate around non-payments, with defaults automatically triggering insolvency proceedings after a time period. Compared to DisComs, GenCos, have a higher debt funding, more so for new capacity. Understanding heterogeneity amongst GenCos (public versus private), or state-wise variations is a separate discussion, but one distortion is that legal frameworks apply disproportionately along different segments of the electricity chain.
Even proposed Amendments to the Electricity Act 2003 seek to add in a new regulatory entity, the Electricity Contract Enforcement Authority (ECEA), to ensure payments to GenCos. However, this proposed entity has no mandate or loci to tighten up payments to the DisComs[27] – which creates a squeeze upon them. This asymmetry needs addressing – how to align risk and returns across the electricity value chain. Profitable generation and transmission, in some cases highly so, cannot sustain with increasingly squeezed distribution. The focus on timely payments to generators must be matched with a focus on timely payments to states for government electricity consumption and promised subsidies.
DisComs should not be viewed as wilfully negligent in their payment delays. The dip in ‘GenCos Dues’ in March of each financial year (Figure 3) shows one side of the coin – as states clear accounts and also give guidance, they often comply. On the other side, the obligations are continually rising both by accumulation as well as running (ongoing) obligations. Of course, this is not meant to gloss over their inefficiencies, or poor quality of service provision. On the other hand, they are perpetually cash-strapped, hitting their ability to not just deliver quality supply but also invest in system improvements. This is one reason many improvements have necessitated central government support through various schemes and programs over the years.
Formal accounts are important, but GST is a mixed bag for electricity. While there are many good reasons to bring electricity under GST purview, it’s ironically helpful to DisComs that electricity is presently outside GST purview. This is because under GST, raised bills immediately require tax payments, even if payments aren’t received. Perhaps GST would nudge a reduction in the dues game. GST implications for states would also be highly asymmetric, given the differences in use of coal across states, an input that is eligible for GST credit.
6.2. Recommendations
6.2.1. You’re going to need a bigger bailout (or loan)
The government needs to plan for a much larger loan package than announced, more so if COVID-19 creates prolonged cash flow challenges. This shouldn’t just be limited to a greater loan limit across India, but also new instruments that do not place all burden on the DisCom.
While one may want to equate receivables with short-term payables, they aren’t equivalent as cumulative receivables cannot be liquidated rapidly – they get accumulated over time. On the other hand, vendors and suppliers, including for generation, need payments more quickly. So do DisComs, but managing this is a political and policy challenge, not one DisComs can handle unilaterally. Even regulators, who manage items like Regulatory Assets, have normally not paid them down in a rapid manner, plus, of course, this only applies in a handful of states.
One option worth considering is rolling over short-term obligations into longer-term debt. It’s worth pointing out that the short-term debt (and even long-term) seen on the books dated March 31, 2019, are largely post the UDAY scheme, which offloaded a large fraction of debt to the state, and recast much of the remaining debt to lower interest rates. While interest rate arbitrage should always be considered, just like finding a cheaper home loan, spreading the loan out purely on liquidity grounds is also an important tool. Of course, this assumes a willing lender, at reasonable if not favourable terms. This should only be done in limited circumstances, where we find credible mechanisms to fix the problems of dues and insufficient tariffs.
Post-COVID-19, while basic life support (through the “stimulus” loans, for example) is important, the structural reforms required cannot be ignored. If we simply kick the can down the road, not only are we delaying the inevitable, we also add time, which, instead of diminishing the problem, makes it much worse given the trendlines of both income statements and balance sheets. This increases the risks of a hard landing.
6.2.2. Tariffs will need to rise
If we assume DisComs avail long-duration loans at reasonable terms, this will necessitate a measurable consumer tariff increase, which in the case of some states could exceed one Rs./kWh for 10 years. All discussions of AT&C loss reduction, while important and can reduce the loan required, don’t solve this problem.
Post-COVID19, this becomes tricky in several ways. Not only is the aggregate macroeconomic picture challenging, historically the balance of tariffs was based on overpayments by commercial and industrial consumers. Not only are they disproportionately hit by the lockdowns and economic slump, there is pressure to lower their tariffs for employment and competitiveness reasons. Thus, any aggregate increase in tariffs will have to, finally, include dedicated effort on raising the tariffs for the under-paying categories of consumers.
6.2.3. Real solutions will need structural reforms and aligning risks
While higher tariffs are one solution, they may not be sufficiently achievable given the magnitude of the problem. Even if these were, these are a solution within the existing framework. Instead, or perhaps in addition, we should also improve the frameworks.
Yes, DisComs are inefficient, not just in terms of AT&C but also quality of supply. Muddling along has been one reason that DisCom operations, planning, and investments haven’t been able to focus on areas like urban ones, where there is a willingness to pay more for quality supply.
The current exercise of DisCom ratings, carried out by ICRA and CARE rating agencies through PFC, should be updated to reflect not just assets and liabilities but also credible plans and tariff implications to resolve the challenges of payables (and receivables).
Post-COVID, if policymakers agree that we need to take a financial haircut, how do we share the pain equitably? The past structure disproportionately placed risks (and, simultaneously, low returns!) on DisComs. The lenders, generators, transmission, etc. will all need to be willing to share the pain. Else, returns risk remaining on paper only, as DisComs continue their spiral downwards.
The liquidity solution via “stimulus” loans explicitly makes the entire chain more asymmetric. Discoms bear the brunt of formalizing dues via new debt. But the underlying financial structure was always highly asymmetric. The March 31, 2020 regulated equity value of just NTPC (which probably covers under a quarter of generation in India) is Rs. 61,811 crore.[28] In contrast, the 2018-19 aggregate DisCom equity value inclusive of capital reserves is negative. Now consider both entities enjoying a regulated rate of return on their equity; DisComs have very little equity, and their returns are clearly not aligned with risks.
Ultimately, the solutions needed are more political than managerial or even regulatory, and this paper helps showcases the looming urgency. Most importantly, the sole focus cannot be on payables by DisComs, that too only on generator payments. New regulatory and policy mechanisms are needed to ensure payments to DisComs materialise (both subsidies and for electricity consumption), and the biggest gap remains from state governments.
An upcoming paper will attempt to better quantify the sources of losses for DisComs, as well as their balance sheets. The challenge isn’t just one of “don’t make losses”, we also need policies and regulations that answer the question, ‘If there is a loss, then what?’ At one extreme, like today, there exist circular outstanding dues. On the other extreme, dues can be formalised, such as fresh loans to pay off GenCos. There is a need to look for other equitable and viable instruments as well, ideally ones that incentivise improved performance, instead of a system with asymmetric risk, or, worse, socialisation of losses or inevitable bailouts.
6.2.4. Improving data and transparency is a low hanging fruit
There is an urgent need to increase the transparency and timeliness of accounts and data across the electricity chain, which means audited, regulatory-grade data, besides bringing all GenCo transactions with DisComs on a common platform or database. This is especially vital for the data for suppliers without a power purchase agreement (PPA), where both volumes and prices could have volatility. Said data should also break down more details including interest and late payment surcharges, other charges, etc. One option is to release quarterly data like many public companies do. A useful interim step would be to segregate bills and payments between current versus historical. After all, when payments are made, it would be important to know which are being made for “past sins” as opposed to present operations.
The ‘PRAAPTI’ portal is a great initiative in facilitating transparency of transactions. However, this initiative will achieve its goal only if all GenCo transactions with DisComs are brought on board. This needs to be done before attempting to enhance the data captured in terms of granularity, such as segregation of interest/LPSC, overdues, outstanding, other charges, etc. Ideally, reporting should also capture the status (existence and utilisation) of any Letter of Credit (LC) mechanisms, which were mandated in 2019 as a payment security mechanism for GenCos for power purchases outside the state. One other critical component, i.e., billed energy, is essential to analyse the impact of cash flow per unit —PRAAPTI today only captures rupees.
On the revenue side, greater breakdowns of trade receivables are important, especially segregating dues from state governments versus other consumers. Even for other consumers, a granular break-up across categories of consumers would be helpful given each segment may have to be tackled differently, in practice, especially for agricultural and residential.
The last need is for not merely income statements and balance sheets to be public, but also cash flow statements, which help us understand the picture beyond booked values (accrual accounting). Ideally, each project should have its own book of accounts. Else, funds from one source could be used to prop up gaps elsewhere. This exact issue was successfully tackled under the real-estate reform bill, RERA, which aimed to stem the almost ponzi-scheme flow of cash from advance sales for upcoming projects to cover costs of already paid-in-full (historical) projects.
6.2.5. One-size doesn’t fit all – we need flexible and innovative solutions
While there is a need for national policy consensus, the instruments needed should vary based on the particular circumstances. For extreme cases, we may require formal bailouts, since incremental improvements, refinancing, etc. may not be enough. As the data on dues, Regulatory Assets, and non-realisation of subsidies show, the national aggregate is usually concentrated in a handful of states. Thus, we need different targets (or more leeway) in tackling problem states.
As Table 3 shows, government dues for consumption vary by state and maybe a threshold system could treat egregiously defaulting states differently than others, to the extent that the Central Government may want to intervene using centre-state fiscal control as a backstop. After all, this instrument was harnessed in the past to handle state dues to NTPC. On the flip side, if we consider carrots instead of sticks, support mechanisms should not become a blanket bailout that writes off mismanagement or operational failures; where required, bailouts should be conditional.
Ultimately, fixing the DisComs isn’t an easy task. Just like with weight control, crash diets rarely work, more so when the fat was accumulated over many years. Like diet and exercise work better in tandem, there is a need to use all available tools to tackle this crisis. Not only has COVID-19 disrupted the status quo of muddling along, technology shifts are forcing change upon the entire DisCom equilibrium. So-called “paying customers” will be the first ones to leave the system for renewable energy along with storage and smart systems. If DisComs don’t improve, they would be relegated to the scraps of the future grid. In contrast, they could evolve to play a meaningful role in an equitable and efficient electricity system.
We thank a number of colleagues and domain professionals who have shared ideas and inputs, including some of the data. A number of experts, especially within the government and PFC, are not listed but we thank them for their clarifications to our queries. We have also benefited from comments and suggestions from Rakesh Mohan, Daljit Singh, and Vikram Singh Mehta, as well as the three anonymous reviewers. We also thank Rishabh Trivedi and Aditya Srivastava for their help with data compilation.
Support for this research was generously provided by the MacArthur Foundation. CSEP recognises that the value it provides is in its absolute commitment to quality, independence, and impact. Activities supported by its donors reflect this commitment and the analysis and recommendations found in this report are solely determined by the scholar(s).
FOOTNOTES
[1] Crore (or cr.) is 10 million; lakh is 100,000.
[2] https://www.livemint.com/news/india/economic-stimulus-rs-90-000-crore-liquidity-injection-for-fund-starved-discoms-11589369762139.html accessed on 24 July, 2020;
https://www.business-standard.com/article/economy-policy/rs-90-000-cr-discom-package-street-anxious-over-impact-on-pfc-and-rec-120052000056_1.html accessed on 24 July, 2020;
https://economictimes.indiatimes.com/news/economy/policy/summing-up-modis-covid-stimulus-takeaways-so-far-from-the-mother-of-all-incentives/articleshow/75758840.cms accessed on 24 July, 2020;
https://www.businesstoday.in/sectors/energy/stimulus-package-20-power-discoms-get-rs-90000-crore-liquidity-jumpstart/story/403738.html accessed on 24 July, 2020;
https://indianexpress.com/article/explained/explained-why-the-govt-had-to-inject-money-into-the-power-sector-6414547/ accessed on 24 July, 2020.
[3] PRAAPTI (Portal): Payment Ratification And Analysis in Power procurement for bringing Transparency in Invoicing of generators (http://PRAAPTI.in), operated by PFC Consulting.
[4] Ministry of Power Press release 16 May, 2020 https://pib.gov.in/PressReleasePage.aspx?PRID=1624496 accessed on 6 June 2020.
[5] Business Standard Dated 15 July, 2020 pp 10, https://epaper.business-standard.com/bs_new/index.php?rt=main/mainpage#6 accessed on 15 July 2020. Note that the Rs. 87,320 crore figure is as attributed to a senior official, but the bottom-up compilation of states’ loans in Figure 7 only comes to Rs. 67,320 crore.
[6] Throughout this paper, we mean DisComs to mean all distribution companies and distributing utilities including integrated companies and power departments.
[7] This compilation across India provides an excellent starting point for the all-India status, but each DisCom’s audited reports have additional headings that may or may not show up in these figure. For example, PFC’s compiled dues for power purchase for BESCOM exclude inter-DISCOM payments which show up in different line items in their audited Annual Report.
[8] “Days” (payable or receivable) compares the respective dues to the annual total payments (payable for power or revenues for sale of power, respectively). For comparison, consumer bills typically have a payment window of about 25 days.
[9] AT&C losses are only for DisComs, and are not the same as system-level T&D (transmission and distribution) losses.
[10] Comparing losses across countries can be challenging due to size differentials and other legacy design differences. But even a country as large as the US has total transmission and distribution losses about 7.6% per EIA for 2018 (accessed 30 July 2020 from
https://www.eia.gov/electricity/state/). In contrast our DisCom losses alone (which include billing and collection failures) are about 2.5 times this amount.
[11] Subsidies are often for selected categories of consumers, especially agricultural. There is a measurement problem here analogous to AT&C losses. Given most irrigation pumpsets are unmetered, DisComs can claim large subsidies for such “consumption” even though some of it may be exaggerated, perhaps to minimise AT&C losses. The Working Group for Agricultural Consumption Study submitted an Interim Report to the Maharashtra Electricity Regulatory Commission on this in January 2020.
[12] Discoms can not only simply disconnect a non-paying consumer if they wanted to, but also take a deposit from every new customer. It is reportedly only the state government or a minority of “well-connected” consumers who continue to consume without being disconnected.
[13] https://www.business-standard.com/article/economy-policy/up-tops-list-of-states-on-power-dues-with-rs-13-000-cr-unpaid-bills-119110100972_1.html accessed on 24 July, 2020.
[14] https://energy.economictimes.indiatimes.com/news/power/state-departments-key-defaulters-on-electricity-bills/72349094 accessed on 24 July, 2020
[15] PFC’s Report on Performance of State Power Utilities 2018-19, Annexure 1.5.
[16] http://PRAAPTI.in accessed on 23 July 2020.
[17] CEA’s Monthly Executive Summary for May, 2020 accessed on 24 July, 2020.
[18] PRAAPTI does indicate payments under dispute, if so listed.
[19] CERC recently notified a reduction in Late Payment Surcharge from 18% down to 12% per annum because of the COVID-19 scenario with a lockdown imposed, a Force Majeure event, but the applicability after 45 days remains. See the Suo Motu PETITION NO.6/SM/2020, April 3, 2020, for details.
[20] PFC’s Report on Performance of State Power Utilities 2018-19, Annexure 1.5.
[21] PFC’s Report on Power Utilities for FY 2018-19, Annexure 1.1(a).
[22] Unit is one kilowatt-hour (kWh), so MU is also million kWh.
[23] Regulatory Assets are dues owed to the Discoms because the Regulator failed to set retail prices (Tariffs) as required, leaving an IOU for reconciliation through future tariff hikes. These are sometimes ostensibly to reduce fare hike shocks, but in reality can be driven by political compulsions to keep tariffs low.
[24] PFC’s PFC Report on Power Utilities for FY 2018-19, Annexure 1.4.
[25] There are many reported cases of delayed vendor payments without attracting penalties, even if they exist on paper, as the projects are not deemed “successfully closed”, often due to loopholes (or worse).
[26] Non-state-owned entities may have more stringent power purchase norms, including payment terms, times, and penalties. This may be one reason states disproportionately use state-owned generators, the other being the 2019 mandate for Letters of Credit (LC), a payment security mechanism for GenCos, operationalised for all out-of-state despatch. It’s not clear if LC norms are being followed universally.
[27] Daljit Singh and Rahul Tongia (2020), “Falling short of addressing the real challenges: Comments and analysis on the Draft Electricity (Amendment) Bill 2020”, Brookings India. Online at https://www.brookings.edu/research/comments-on-the-draft-electricity-amendment-bill-2020/.
[28] NTPC 16th Investor’s Meet, Mumbai, August 17, 2020.
Rajasekhar Devaguptapu
Rahul Tongia


Find on this page
The Centre for Social and Economic Progress (CSEP) is an independent, public policy think tank with a mandate to conduct research and analysis on critical issues facing India and the world and help shape policies that advance sustainable growth and development.