
Input-output transactions table: Odisha 2015-16
Reading Time: 9 minutesEditor's Note
We thank the Directorate of Economics and Statistics, Government of Odisha for the data support for this project.
Odisha is an eastern Indian state, with a coastline along the Bay of Bengal. It is the eighth largest state in the country by area and has the eleventh largest population[1]. Odisha’s economy is the sixteenth biggest in the country, with a gross state domestic product (GSDP) of Rs 4.1 lakh crore[2] (for the year 2019-20, at constant 2011-12 prices), and a per capita GSDP of Rs 89,841, lower than India’s gross domestic product (GDP) per capita of Rs 1,08,620 (provisional estimates[3]). The contribution of agriculture, industry, and services to the GSDP is 27%, 32%, and 41%, respectively[4].
DOWNLOADS
Odisha is a mineral-rich state, accounting for 27% of the country’s royalty accrual as of 2017-18[5]. Odisha has significant shares of some of the country’s mineral reserves of iron ore (33%), chromite (96%), bauxite (51%), and manganese (44%).[6] Despite the immense potential of mineral resources-led development in the state, Odisha falls behind in various development indices, such as its Human Development Index (HDI) at 0.606 compared to the nation-wide average HDI of 0.647 (for the year 2018[7]).
Input-output transactions table: India 2015-16
The economic importance of sectors of mining and their interaction with other sectors of production in Odisha can be analysed through their input-output interactions. The input-output transactions matrix is a useful quantitative economic tool that may be used by industry and policymakers for understanding interlinkages across sectors of production. This paper constructs an Input-Output Transactions Table of Odisha state, for the year 2015-16.
Odisha’s large mineral endowment and relatively weak development indicators show that there is a potential for mineral-development-led economic growth. Constructing the state’s input-output table allows for economic multipliers to be computed, as well as making use of computable general equilibrium models to estimate how the economy would react to changes in policies. While the primary motivation of this project is to understand the interlinkages of the mining sectors with other sectors of Odisha’s economy, the computed input-output table may also be used for a similar analysis of other sectors as well.
The 2015-16 input-output table for India, constructed by the authors of this paper[8], is useful for understanding the interlinkages of sectors at the national level. However, it does not provide details of the sectors at the state level. For example, the economic structure of the mining sectors differs by state, due to geographical differences and resource endowments. The major mining states in India are Chhattisgarh, Gujarat, Jharkhand, Karnataka, Madhya Pradesh, Odisha, and Rajasthan. Hence the need to construct state-specific I-O tables.
Regional input-output tables have been constructed for Indian states in the past, such as Punjab’s I-O table for 1983-84[1]. The National Council of Applied Economic Research works on regional tourism satellite accounts for different states of India. State-specific input-output information is used to facilitate estimation of the indirect contribution of tourism to the economy, for example in a recent study of Himachal Pradesh[2]. The Department of Economics and Statistics, Delhi, constructed the Union Territory’s 2007-08 Input-Output table with nine sectors[3].
76-Sector I-O Structure
The latest India I-O table published by the Ministry of Statistics and Programme Implementation (MoSPI) was for 2007-08, which contains 130 sectors of production. One of the weaknesses of the structure is that the primary agriculture grain sectors include milling as well. When constructing the 2015-16 Input-Output table for India, a separate grain milling sector was created by separating the milling activity from the grain crops. The modified table has 131 sectors of production.[4]
The state-level I-O tables are constructed based on the data available with the respective state’s Directorate of Economics and Statistics (DES). Based on the data available from DES, Odisha, 76 sectors of production were chosen for constructing Odisha I-O Table, as detailed data was not available for all 131 sectors. The India I-O table was aggregated from 131 to 76 sectors. Annex-A provides the schedule of sectoral concordance.
An example of the consolidation of sectors is textiles. The 131-sector India I-O table has eight textile sectors, viz. Khadi, cotton textiles (handlooms); cotton textiles; woollen textiles; silk textiles; art silk, synthetic fibre textiles; jute, hemp, mesta textiles; carpet weaving; and miscellaneous textile products. These eight sectors were aggregated into one sector, “textile products”. Other sectors for which a similar consolidation was done include sectors of agriculture, chemicals, and machinery. The mining sectors were left unchanged, due to the significance of mining in the state.
Data sources
Multiple data sources were used for the construction of Odisha I-O table with the Directorate of Economics and Statistics (DES), Odisha’s statistics agency, being the primary source[5]. DES, Odisha provided the following data:
- Output and input data for various crops, and the GVA for the agriculture sector
- GVA data for the livestock, fishery, and forestry sectors
- GVA data for select mining sectors
- GVA of various manufacturing sectors at a 2-digit NIC-2008 level
- GVA for various services sectors
To complement the data provided by DES, Odisha, additional data was taken from MoSPI. MoSPI provides other data on the manufacturing sectors in Odisha included in the Annual Survey of Industries (ASI) 2015-16[6] and the Unincorporated Non-Agricultural Enterprises (Excluding Construction) Survey 2015-16[7]. ASI provided data from the organised manufacturing sectors, and the Unincorporated Enterprises Survey from the unorganised manufacturing sectors. The unit-level data from these two sources were consolidated for various manufacturing sectors in congruence with the sectors specified in the input-output table. The aggregate sectoral data were constructed by summing corresponding information of organised and unorganised sectors of manufacturing. The surveys provided data on the inputs, outputs, and GVA of various manufacturing sectors.
Data for final consumption were extracted from various sources:
- Key Indicators of Household Consumer Expenditure in India 2011-12 for Private Final Consumption Expenditure (PFCE). This was the most recent household expenditure survey available. The PFCE data for Odisha I-O table 2015-16 was computed by assuming that the ratio of a sector’s PFCE in Odisha to the same sector’s PFCE in India in 2011-12 remained the same in 2015-16.
- DES, Odisha has provided data on Gross Fixed Capital Formation (GFCF) for 2011-12. The data for Odisha I-O table 2015-16 was computed by assuming that the ratio of a sector’s GFCF in Odisha to the same sector’s GFCF in India in 2011-12 remained the same in 2015-16.
- The Odisha State Budget 2015-16 was used to provide estimates of the Government Final Consumption Expenditure (GFCE)[8].
Assumptions
Some assumptions were made in the computation of the Odisha I-O table. This was primarily due to a lack of availability of data. Coefficients and ratios from India I-O Table 2015-16 were used to determine the input structure and indirect tax values for various sectors where detailed data were not available.
India I-O Table 2015-16 was constructed using industry (or producer) technology assumption: “all products produced by an industry are produced with the same input structure”[9]. This same assumption applies to the Odisha I-O Table.
Computation of the I-O Table
As specified earlier, Odisha’s I-O table has 76 columns for intermediate consumption. For the primary and service sectors, data from DES, Odisha and India I-O table were used to compute the input structure as well as estimates of the net indirect taxes (NIT) and gross value added (GVA). For the manufacturing sectors, data from DES, Odisha was used alongside the data from national-level surveys (ASI and Unincorporated Enterprises Survey).
The columns of an I-O transactions table represent the cost structure of the respective sectors. It reports the inputs of goods and services used (values of intermediate inputs) and net indirect taxes, NIT (indirect taxes minus subsidies), and returns to factors of production, referred to as the gross value added (GVA). The output of a sector is computed as the sum of values of intermediate inputs, NIT, and GVA.
The I-O table has additional six columns to report the final use columns: Private Final Consumption Expenditure (PFCE), Government Final Consumption Expenditure (GFCE), Gross Fixed Capital Formation (GFCF), Change in Stocks (CIS), Exports – Imports (i.e. net trade between the state and other states and nations; and Valuables.
The rows of the I-O table refer to the supply from a specific sector to intermediate use and final use. which matches with the sum of the column. These two values must match for the I-O table to be considered ‘balanced’.
Balancing the Input-Output Table
The balancing of the I-O table is done through adjustments in the exports and imports columns in the final demand section. Upon completing information for all other columns of the I-O table, the difference between the sum of the column and the sum of the row for a given sector was attributed to the net trade value (i.e. Exports – Imports, or X-M). Unlike the India I-O, the state I-O does not have separate columns for exports and imports. A net X-M column is created in which a positive residual value implies that there were more exports than imports, and vice versa for negative residual values.
While the state I-O table is implicitly balanced through this method, some common-sense checks were made by comparing the X-M column to some data facts about Odisha’s economy. Some examples of these checks include:
- Odisha is a large producer of Iron Ore, Bauxite, and Other Metallic Minerals, all of which show positive values in the X-M column.
- Similarly, the Iron and steel alloys, casting, and foundries sector shows there is a net export from the state, which matches with a large number of iron ore processing plants in the state.
- The petroleum products sector also shows that there are exports from the state. Indian Oil Corporation Limited’s Paradip Refinery[10] is located in Odisha, which is also the country’s sixth-largest refinery by capacity.
Limitations of the methodology
Given the non-availability of necessary state-specific data, the Odisha I-O table has been constructed with some assumptions. As discussed in the literature review, the method employed to construct the state I-O is not as rigorous as for India I-O table. The supply and use tables are not available at the state-level. In this case, India I-O table technical coefficients were used, which is not necessarily representative of Odisha’s economy. We are trying to sieve through the data of major mining companies in Odisha to work out technical coefficients which would better represent Odisha’s specificities. Trade and transport margins, technological coefficients, and some final consumption coefficients have also been taken from the national I-O table.
Macroeconomic indicators, such as GSVA (Gross State Value Added) and GSDP, may be extracted from the computed Odisha I-O table and compared with the data published by DES, Odisha:
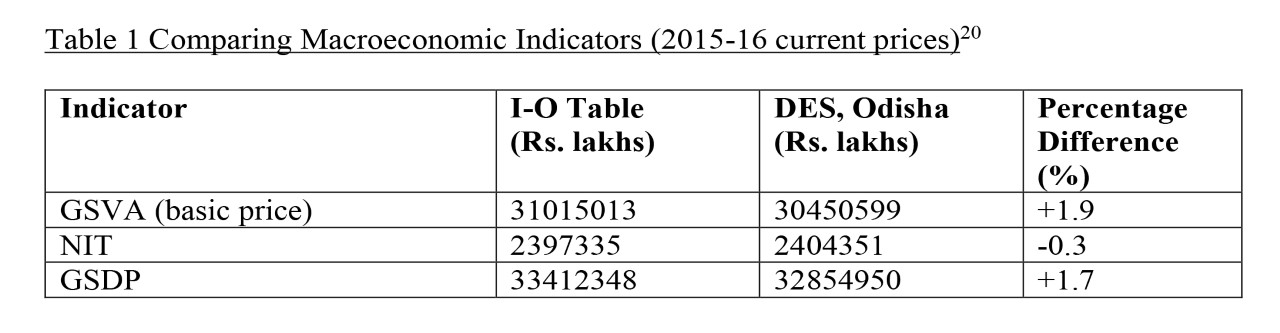
The Reserve Bank of India publishes GSDP data for all states, with a sector-wise breakdown, in the Handbook of Statistics on Indian States (the source of this data is the Central Statistics Office (CSO)).
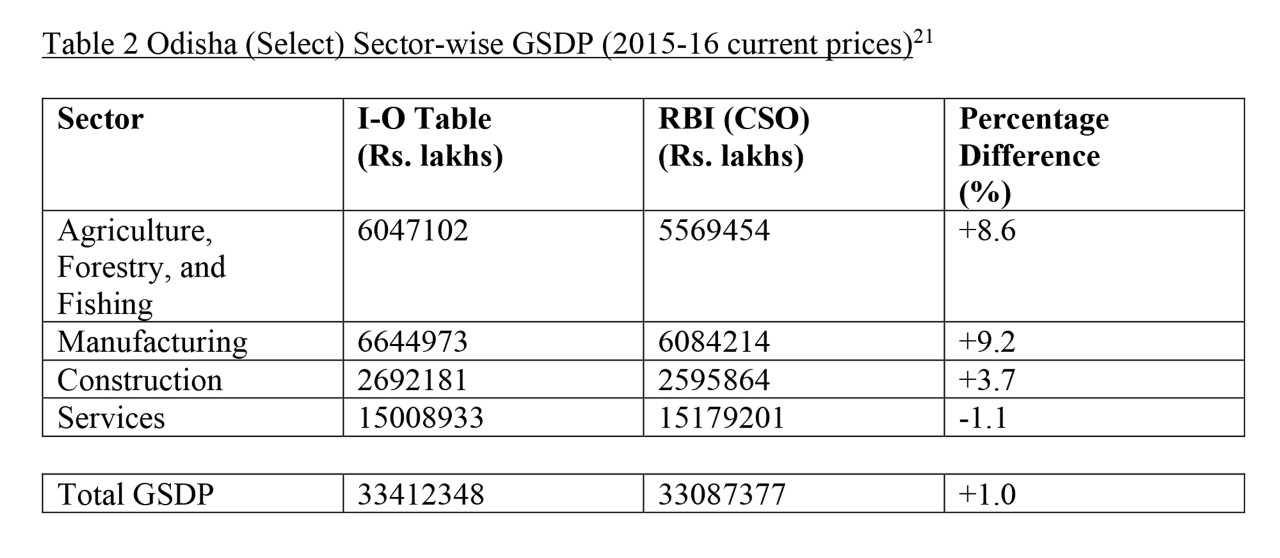
The total state GSDP matches well with the data given by both Odisha DES and CSO. There are some discrepancies in the GSDP values for the sectors, and the I-O table may need some revisions to better match the data published by CSO.
Multipliers refer to the change in one economic variable due to a change in another variable (or variables).
The three important types of multipliers that may be computed using information from a I-O table are defined as follows:
- Output multipliers: the ratio of the change in direct and indirect output to the change in direct output due to a one unit increase in final use in a given sector[13]
- GVA (income) multipliers: the ratio of the change in direct and indirect GVA to the change in direct GVA due to a one unit increase in final use in a given sector[14]
- Employment multipliers: the ratio of the change in direct and indirect employment to the change in direct employment due to a one unit increase in final use in a given sector[15]
Multipliers are important indicators for the policymakers to visualise which sectors will yield the maximum change in output or GVA for a given input of final use.
Using the computed I-O table, the output and GVA multipliers may be calculated for all sectors. Employment multipliers may also be calculated using the I-O table, with the use of employment coefficients, which would require the employment numbers for all sectors of the I-O table. Employment numbers are currently not available at this level of detail. The output and GVA multipliers computed from the I-O table may be found in Annex-B.
Library with many shelves and books, diminishing perspective and shallow dof Central Statistics Office (Industrial Statistics Wing) – MoSPI, Govt. of India. (2019, March). India – Annual Survey of Industries 2015-16. Retrieved June/July, 2020, from http://microdata.gov.in/nada43/index.php/catalog/143
Chadha, R., Saluja, M., & Sivamani, G. (2020, January). Input-Output Transactions Table: India, 2015-16 (Tech.). Retrieved January, 2020, from Brookings India website: https://www.brookings.edu/wp-content/uploads/2020/01/Input-Output-Transactions-Table.pdf
Directorate of Economics and Statistics, Government of Delhi. (2013). Input-Output Table of Delhi (2007-08) (Tech.). Retrieved June/July, 2020, from http://ihbas.delhigovt.nic.in/wps/wcm/connect/6b100880413535fdbd78bf8afaa255b4/IOTT.pdf?MOD=AJPERES&lmod=-1348683932&CACHEID=6b100880413535fdbd78bf8afaa255b4
Directorate of Economics and Statistics, Government of Odisha. (n.d.). Retrieved from http://desorissa.nic.in/
Directorate of Economics and Statistics, Odisha. (2020, January). Estimates of State Domestic Product, Odisha (Rep.). Retrieved June/July, 2020, from http://www.desorissa.nic.in/pdf/estimate-sdp-2020.pdf
Finance Department, Government of Odisha. (2015, March). Odisha Budget 2015-16 At a Glance. Retrieved June/July, 2020, from https://finance.odisha.gov.in/Budgets/2015-16/Annual_Budget/Budget_at_a_Glance_(Full).pdf.
Global Data Lab. (2019). Subnational Human Development Index (4.0). Retrieved June/July, 2020, from https://globaldatalab.org/shdi/shdi/.
Indian Bureau of Mines. (2017, July). National Mineral Inventory (As on 01-04-2015). Retrieved June/July, 2020, from https://ibm.gov.in/index.php?c=pages&m=index&id=866.
IndianOil Corporation. (2016). Pradip Refinery. Retrieved June/July, 2020, from https://www.iocl.com/AboutUs/Paradip-Refinery.aspx
Ministry of Mines, Government of India. (2019, November). Annual Report 2018-19 (Rep.). Retrieved June/July, 2020, from https://mines.gov.in/writereaddata/UploadFile/English637094270360450099.pdf
Ministry of Statistics and Programme Implementation. (2018). Area and Population – Statistical Year Book India 2018. Retrieved June/July, 2020, from http://mospi.nic.in/statistical-year-book-india/2018/171
Ministry of Statistics and Programme Implementation. (2020, February 28). State-wise SDP. Retrieved June/July, 2020, from http://mospi.nic.in/sites/default/files/press_releases_statements/State_wise_SDP_28_02_2020.xls
National Council of Applied Economic Research. (2019, December). India: Regional Tourism Satellite Accounts, 2015-16 Himachal Pradesh (Rep.). Retrieved June/July, 2020, from http://tourism.gov.in/sites/default/files/Other/RTSA Himachal Pradesh 201516.pdf
Northern Ireland Statistics and Research Agency. (2016). The Analytical Input-Output tables. Retrieved July/August, 2020, from https://www.nisra.gov.uk/statistics/economic-accounts-project/analytical-input-output-tables
NSSO – MoSPI. (2017, June). Key Indicators of Unincorporated Non-Agricultural Enterprises (Excluding Construction) in India 2015-16. Retrieved June/July, 2020, from http://www.mospi.gov.in/sites/default/files/publication_reports/NSS_KI_73_2.34.pdf
OECD. (2001, November). Glossary of Statistical Terms – Industry Technology. Retrieved June/July, 2020, from https://stats.oecd.org/glossary/detail.asp?ID=1345
PRS Legislative Research. (2020, February 26). Odisha Budget Analysis 2020-21 (Rep.). Retrieved June/July, 2020, from PRS Legislative Research website: https://www.prsindia.org/parliamenttrack/budgets/odisha-budget-analysis-2020-21
Reserve Bank of India. (2019, March). Handbook of Statistics on Indian States. Retrieved July/August, 2020, from https://m.rbi.org.in/Scripts/AnnualPublications.aspx?head=Handbook+of+Statistics+on+Indian+States
Saluja, M. (1990). Structure of Punjab Economy Inter Industrial Flows and Patterns of Final Demand: 1983-84 (Publication).
FOOTNOTES
[1] MoSPI Population http://mospi.nic.in/mospi_new/upload/SYB2013/CH-2-POPULATION/Table 2.1.xls
[2] MoSPI State-wise SDP http://mospi.nic.in/sites/default/files/press_releases_statements/State_wise_SDP_28_02_2020.xls
[3] MoSPI GDP Estimates http://www.mospi.gov.in/sites/default/files/press_release/PRESS%20NOTE%20PE%20and%20Q4%20estimates%20of%20GDP.pdf
[4] PRS Odisha Budget 2020-21 https://www.prsindia.org/parliamenttrack/budgets/odisha-budget-analysis-2020-21
[5] Ministry of Mines Annual Report 2018-19 https://mines.gov.in/writereaddata/UploadFile/English637094270360450099.pdf
[6] Mineral and State Wise Reserves and Resources 01.04.2015 https://ibm.gov.in/index.php?c=pages&m=index&id=866
[7] Global Lab Sub-national HDI https://globaldatalab.org/shdi/shdi/
[8] Input Output Transactions Table: India, 2015-16, Rajesh Chadha, M. R. Saluja, and Ganesh Sivamani https://www.brookings.edu/wp-content/uploads/2020/01/Input-Output-Transactions-Table.pdf
[9] OECD Glossary of Statistical Terms https://stats.oecd.org/glossary/detail.asp?ID=1345
[10] Paradip Refinery, IndianOil https://www.iocl.com/AboutUs/Paradip-Refinery.aspx
[11] DES, Odisha, SDP Estimates http://www.desorissa.nic.in/pdf/estimate-sdp-2020.pdf
[12] RBI, Handbook of Statistics on Indian States (from Central Statistics Office) https://m.rbi.org.in/Scripts/AnnualPublications.aspx?head=Handbook+of+Statistics+on+Indian+States
[13] Quoted from NISRA, Analytical Input Output Tables: https://www.nisra.gov.uk/statistics/economic-accounts-project/analytical-input-output-tables
[14] Ibid.
[15] Ibid.


Find on this page
The Centre for Social and Economic Progress (CSEP) is an independent, public policy think tank with a mandate to conduct research and analysis on critical issues facing India and the world and help shape policies that advance sustainable growth and development.