
MacroInsights: GDP Revision – Key Facts and Some Quirks
Reading Time: 4 minutesMacroInsights, a Centre for Social and Economic Progress (CSEP) series, dissects key economic developments and policy issues of macroeconomic significance. It offers timely, evidence-based analysis to inform public debate and policymaking.
The revised back series expected by the year end may shed more light
The new national accounts, rebased from 2011-12 to 2022-23, has stirred many controversies. There’s universal agreement on the improved methodology and better measurement of India’s informal economy. Questions and doubts have emerged however on some aspects, notably, a sizeably reduced nominal size of the economy, choice of price deflators, and other puzzles. While we await the back series, a quick analysis lays out some of the important facts and noticeable quirks.
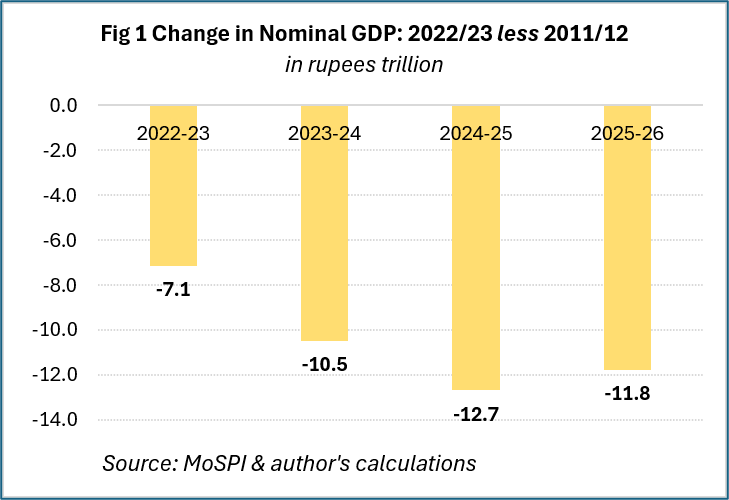
Nominal GDP 3.3 percentage points lower in FY23-FY26, roughly Rs 10 trillion each year (Figure 1). The most controversial by far has been this year’s first quarter real GDP growth of 7.8% over a sharply reduced base (7% or ~Rs 6 trillion) in FY26:Q1, almost half of which originate from successive, four-step decreases in Nov’25-Aug 31’26 in the 2022/23 series itself. Past nominal GDP revisions in India have been small, mostly upwards (the 2011/12 rebasing showed a small reduction) reflecting the principle that rebasing needn’t change the value of output at that year’s own prices (i.e., nominal GDP). Rebasing, in the strict sense, is about real or constant-price GDP – the new base year prices are used as weights to deflate output of other years into constant prices and compare volumes over time without the noise of price change. Therefore, switching the base year for real GDP leaves the nominal figures for each year as they were – only the real GDP numbers and the implied deflator change.
Because a comparable series – neither a parallel 2011/12, nor recast 2022/23 national account series – is unavailable, an accurate identification of what’s driving the nominal GDP downgrades must wait. The present revision is a comprehensive methodological overhaul, implying feedback into nominal GDP. It is sourced to two major changes – separate input-output deflators and realistic informal sector surveys – both superior to past methods. Using separate input-output deflators is conceptually correct, internationally harmonized and a better measure because of granular price data across industries and output categories. Likewise, the switch from benchmark, proxy indicators to more representative surveys of the labour force and unincorporated enterprises (ASUSE, PLFS) for the informal sector is unequivocal. Indeed, initial surveys showed decreased informal manufacturing units and employment relative to 2015-16, and a revision was not unanticipated, therefore.
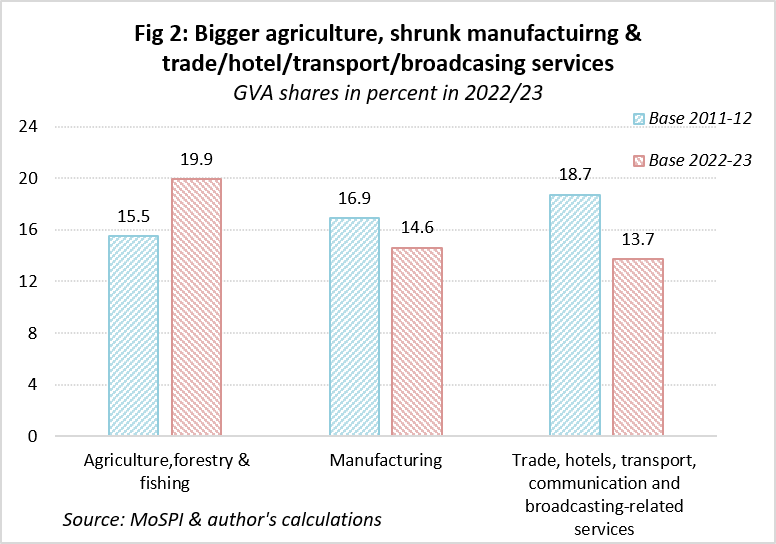
Economic structure alters – bigger agriculture, smaller manufacturing and trade, hotels, transport sectors. Rebased agriculture & allied sector share is 20% against 15.5% before in the common base year, 2022/23. Figure 2 shows 2.29-percentage points lesser manufacturing share and a 5-point shrinkage in that of THTCB sector (Trade, hotels, transport, communication and broadcasting services). Directionally, the progressive decline in agriculture is observed continuing though – manufacturing and THTCB inched up to FY26, while still lagging agriculture share by a respective 2.1 and 3 percentage points. This is a complete reversal of the relatively larger manufacturing and THTCB sector shares before. Manufacturing must now pace faster to reach its initial, older share in the economy it appears! The bigger question though is what India’s revised economic structure would be upon backcasting the new series to 2011-12. It is no surprise that agriculture contributed more than five times on average each year in FY24-FY26 or 1.3 percentage points against a comparable quarter point in the older series! THTCB however, retains its contribution in the new series because of substantially faster growth.
The trajectory of real growth changes – hefty downgrade for 2023-24 (Figure 3) – no less than 1.9 percentage points. FY25 (1st revised estimates) and FY26 (provisional estimates) growth rates are upgraded. FY24 reverses our existing economic understanding, viz., a sharp 9.2% rebound from the FY23’s growth drop (7.6%) after the strong recovery from the pandemic in FY22 (9.7%). The new, directional shift in the observed path of real GDP growth in FY24 – a 30-basis point moderation instead of a 1.6-point rise before – also questions macroeconomic policy settings in hindsight! Further, the FY25-FY26 estimates are not yet final. This turns the past uncertain, increasing anxiety about future revisions!
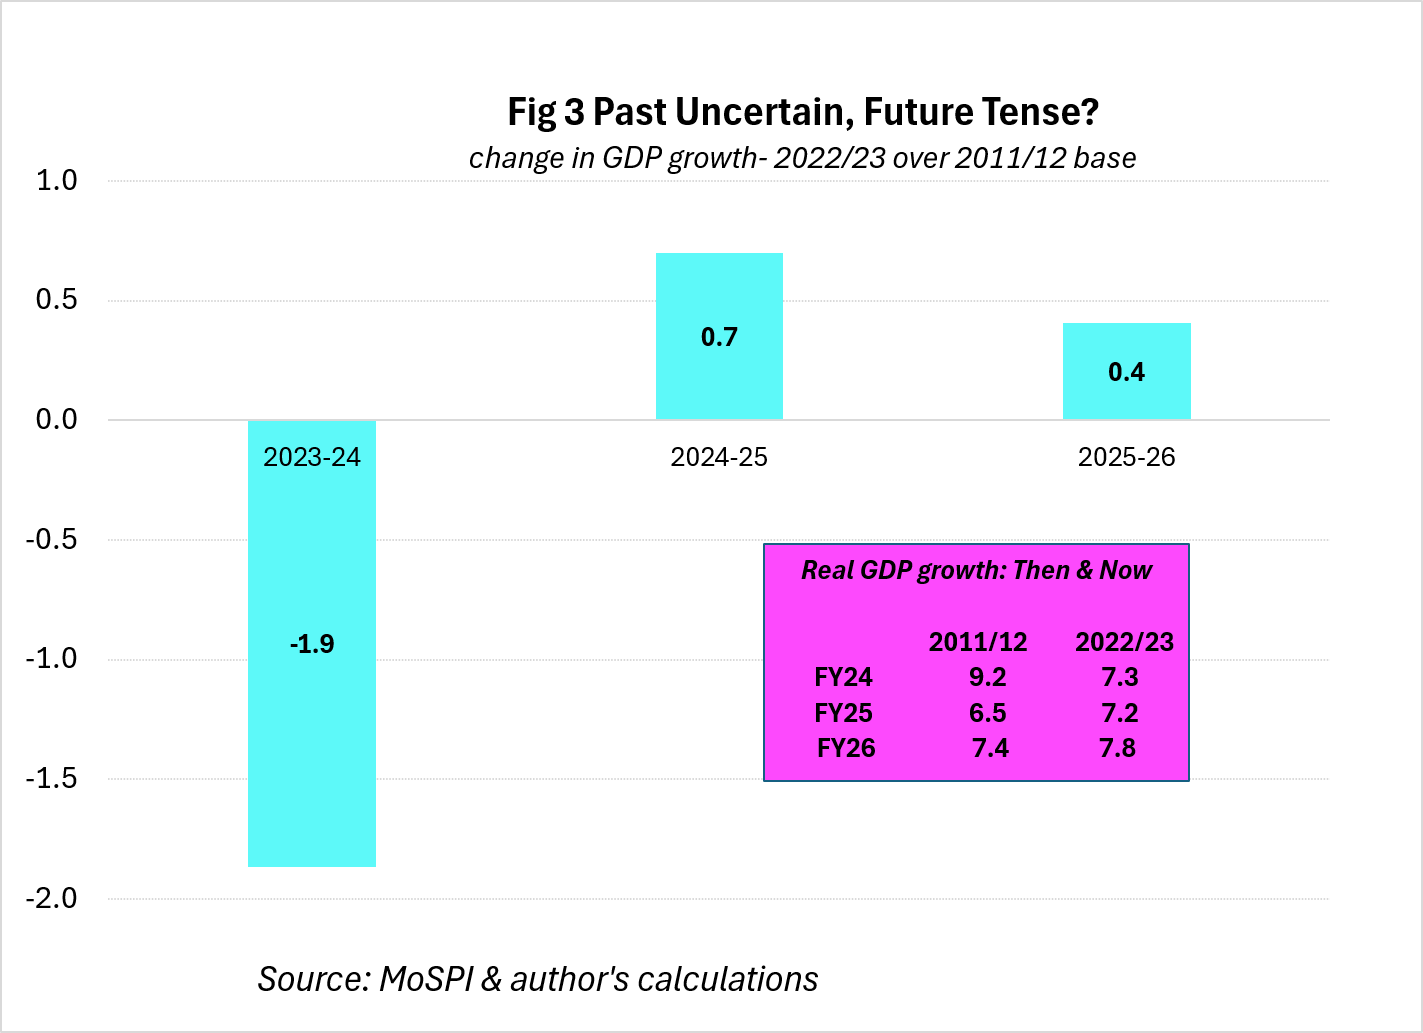
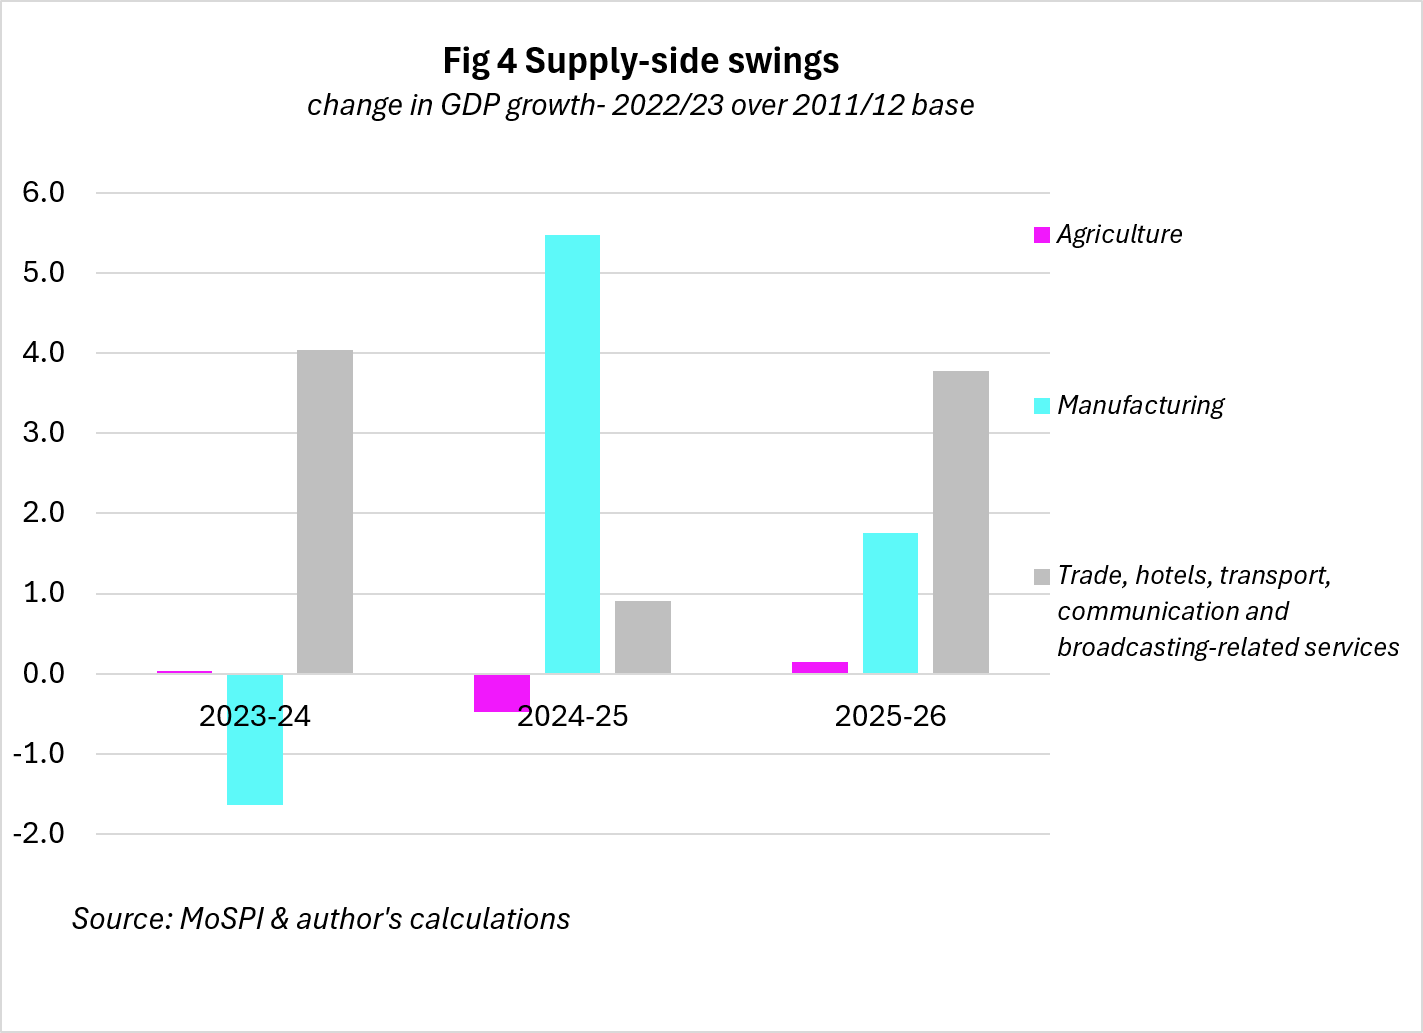
Figure 4 shows smaller supply-side reduction, 1.1 percentage points in FY24, largely concentrated in manufacturing and THTCB sectors and hinting at the role of new deflators, methods and measures. Finally, the rebased real GDP growth path is smooth compared to higher output variability observed in the older series (Figure 3, & textbox).
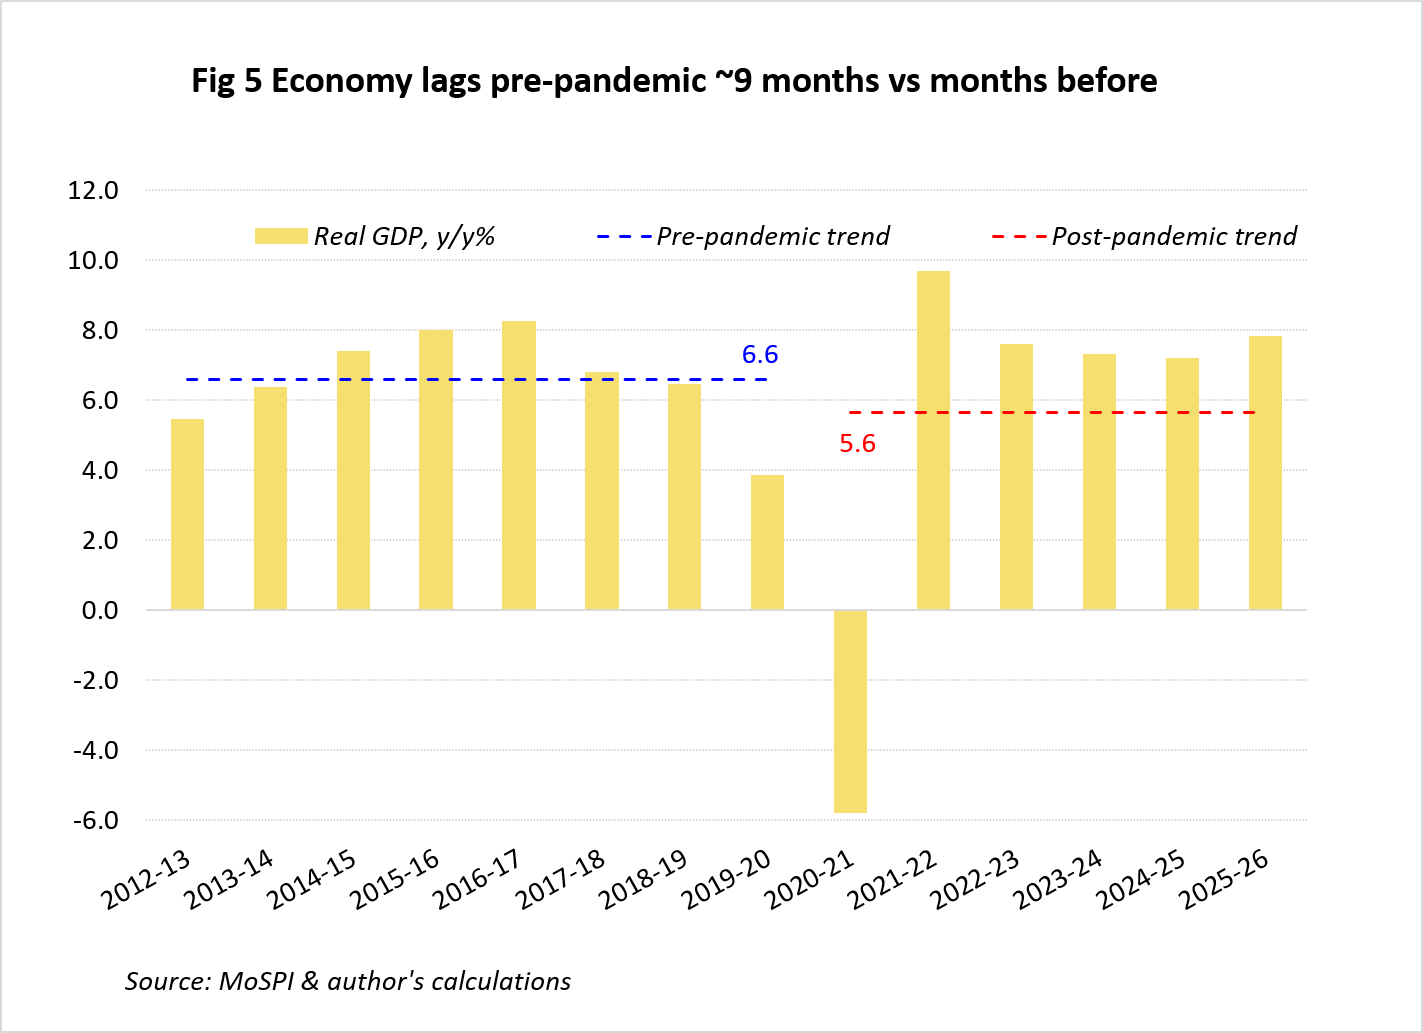
Post-pandemic, trend growth lowers to 5.6% (5.8% before), the economy was ~5% below potential in FY26 versus 4.4% earlier and lagged by another month upon rebasing.
Figure 5 shows the post-COVID trend growth a full percentage point lower, inclusive of 2020-21 contraction that drives most of the shortfall. The new observed growth path for FY26 indicates the economy 0.8 years or ~9.5 months behind in the catch-up to the pre-pandemic trend against a month shorter under the older base.
Read Previous Articles:
MacroInsights: Exceptional Credit Growth—What Does It Signal?
MacroInsights: Borrowed Time—Household Debt Can No Longer Mask India’s Consumption Slowdown
MacroInsights: Rupee Pressures—Then and Now: Why This Isn’t 2013 but a Structural BoP Problem
MacroInsights: Gulf War Shock—How Resilient is the Economy
MacroInsights: Crowding-Out? Shrinking Savings, High Public Borrowing Impact Interest Rates

Renu Kohli


Find on this page

The Centre for Social and Economic Progress (CSEP) is an independent, public policy think tank with a mandate to conduct research and analysis on critical issues facing India and the world and help shape policies that advance sustainable growth and development.